Week 1. The Firm as a Labor-Allocation System: Frameworks, Facts, and Measurement
Learning Objectives
By the end of this week, students should be able to:
distinguish workers’ skills from effort, assignment, managerial inputs, and coordination;
explain why wages, output, evaluations, and welfare are different objects;
translate an organizational decision into a testable labor mechanism;
identify the records and variation a credible study would require;
state what a study within one firm does and does not establish.
Opening Orientation
Central question: What becomes visible when we study workers, jobs, managers, and teams inside firms rather than treating the firm as a single production unit?
Consider two workers with the same occupation, education, and contracted hours. They may face different customers, supervisors, schedules, incentives, access to colleagues, or opportunities for promotion. Even identical worker attributes need not imply identical output or identical welfare. Conversely, similar observed output can mask different effort costs, task difficulty, or support from colleagues. The empirical question is not simply who performs better. It is which part of the organization generates the difference, and what would change under another organizational rule.
This course studies the firm as a labor-allocation system. The firm does more than purchase a quantity of labor. It selects people, assigns work, creates information, evaluates performance, delegates authority, develops skills, and divides surplus. Workers respond through effort, cooperation, applications, learning, bargaining, and exit. The relevant choices therefore occur both between firms and within them.
Three readings orient the course. Lazear and Shaw provide the personnel-economics foundations; Hoffman and Stanton connect recent research on people and practices to productivity; Benson and Shaw organize research around what managers actually do Lazear & Shaw, 2007Hoffman & Stanton, 2025Benson & Shaw, 2025. These are complementary reading maps, not three versions of the same compulsory survey. Week 1 establishes the framework used to read the empirical papers that follow.
Core Points
Bridge
Labor I and Labor II provide the language of labor supply, human capital, search, wages, and firm behavior. Here we open the firm and study the decisions behind those aggregate objects. The special topics on behavior, gender, technology, and labor design supply relevant mechanisms; this course organizes them around a continuing employment relationship rather than a particular shock or population.
The recurring sequence is organizational decision → worker response → observable outcome → credible comparison → firm and worker incidence. Week 1 introduces that sequence. Later weeks deepen individual mechanisms rather than restarting the course from a new model each time.
Field Core
1. Define the organization before asking whether it performs well
Start with actors and decisions. A firm owner may value profits; a frontline supervisor may be rewarded for team targets; an employee may value earnings, predictable hours, learning, or promotion. These objectives can coincide, but need not. The first task is to identify who chooses the rule, who implements it, and who responds.
The observational unit matters just as much. A worker-month panel is useful for wages and retention. A worker-task-day panel may reveal output and task assignment. A manager-team panel can reveal span of control and team outcomes. A plant panel may measure production and management practices but cannot automatically explain individual careers. Legal employers, establishments, teams, managers, and occupations are not interchangeable identifiers.
Baker, Gibbs, and Holmström’s study of personnel records shows what becomes visible inside a firm: job levels, transitions, promotion patterns, and pay variation within as well as across levels Baker et al., 1994. Use it as an example of disciplined descriptive work. A hierarchy and transition matrix are informative economic objects before any causal coefficient is estimated; they are not, on their own, evidence that the hierarchy is efficient or discriminatory.
In class, translate a raw title such as “senior analyst” into a data question. Is it a pay grade, a supervisory role, a task family, or a renamed job? A title change can be a promotion, a reclassification, or an administrative artifact. Students should specify what evidence would distinguish these possibilities before creating a promotion indicator.
Table 1:Organizational decisions, response margins, and observable records
| Decision | Worker or organizational response | Records needed | What a simple outcome does not establish |
|---|---|---|---|
| Recruit and select | Apply, accept, reject, begin probation | All applicants, test scores, evaluations, offer dates, starts | Performance among hires does not reveal the performance of rejected applicants. |
| Assign workers to jobs | Specialize, move, take tasks of different difficulty | Job/task histories, opportunities, capacities, workload and difficulty | Current-job performance does not reveal comparative advantage in an untried role. |
| Measure and reward | Effort, gaming, task substitution, selection | Pay formula, performance definitions, quality, hours and missingness | A changed metric need not be a change in valuable output. |
| Allocate authority | Delegate, teach, evaluate, retain, block mobility | Manager spells, spans, decisions, team assignments and surveys | A manager fixed effect alone does not establish a causal manager contribution. |
| Develop and promote | Train, learn, apply internally, remain or exit | Training offers/participation, eligibility, applications, grades and exits | A promotion is not necessarily a pure reward or a pure productivity improvement. |
| Coordinate teams | Cooperate, learn, pressure peers, free ride | Team membership, task dependencies, interaction timing and team output | An individual-output measure may omit team production or spillovers. |
| Set pay and amenities | Bargain, accept, search, quit | Compensation components, hours, schedules, offers and welfare measures | Low quits alone do not establish high welfare or monopsony. |
This is the course’s proposed measurement map. Empirical entry points include Baker et al., 1994Hoffman et al., 2018Benson et al., 2019Mas & Pallais, 2017.
2. A compact model: people, jobs, effort, and organizational rules
The following is a teaching framework, not a claim to reproduce any cited paper’s exact model. Let the organization choose rules
Here indexes the firm; is the workforce selected, the assignment rule, the pay rule, management and authority, collaboration, and training. For worker at time , performance in task or job can be represented as
Here is output, the production function for job , persistent skill, accumulated knowledge, and effort. The index identifies the current manager; measures manager inputs, the relevant team environment, and an output shock. The notation is intentionally permissive: a manager can affect assignment or information, not just add a fixed quantity to output.
The firm chooses rules anticipating workers’ responses. One accounting representation is
The objective is expected profit for the accounting period: is revenue, compensation, the cost of organizational practices, and turnover costs. Choices remain subject to production, staffing, contractual, and legal constraints. This is not an assumption that observed firms implement the globally optimal rule. Limited information, managerial self-interest, coordination costs, and implementation failures can make observed choices depart from that benchmark. Nor is firm profit the course’s welfare objective.
An employee instead evaluates a bundle:
Here is worker value, utility from pay, effort cost, the value of job amenities, and a discount factor. The continuation value includes learning, promotion prospects, and future outside options. A pay increase, a task transfer, and a better supervisor may therefore improve welfare through different channels. Mas and Pallais provide an empirical example of valuing work arrangements through choices over job offers rather than inferring amenity value from a single wage comparison Mas & Pallais, 2017.
What the framework buys us. A changed rule can affect the workforce, what workers do, how they do it, what they learn, and whether they remain. The model tells us which records are needed to separate these responses. It does not tell us that the responses are identified just because all the variables appear in a regression.
3. Assignment: the best worker is not necessarily the worker for this job
Take two workers and two jobs with the following hypothetical outputs. These numbers are a constructed teaching example, not empirical estimates.
| Worker | Job 1 | Job 2 |
|---|---|---|
| A | 12 | 11 |
| B | 10 | 3 |
Worker A has an absolute advantage in both jobs. Assigning A to Job 1 and B to Job 2 yields 15. Assigning B to Job 1 and A to Job 2 yields 21. A ranking of individual ability is insufficient: assignment depends on comparative advantage and on the opportunity cost of occupying a particular role.
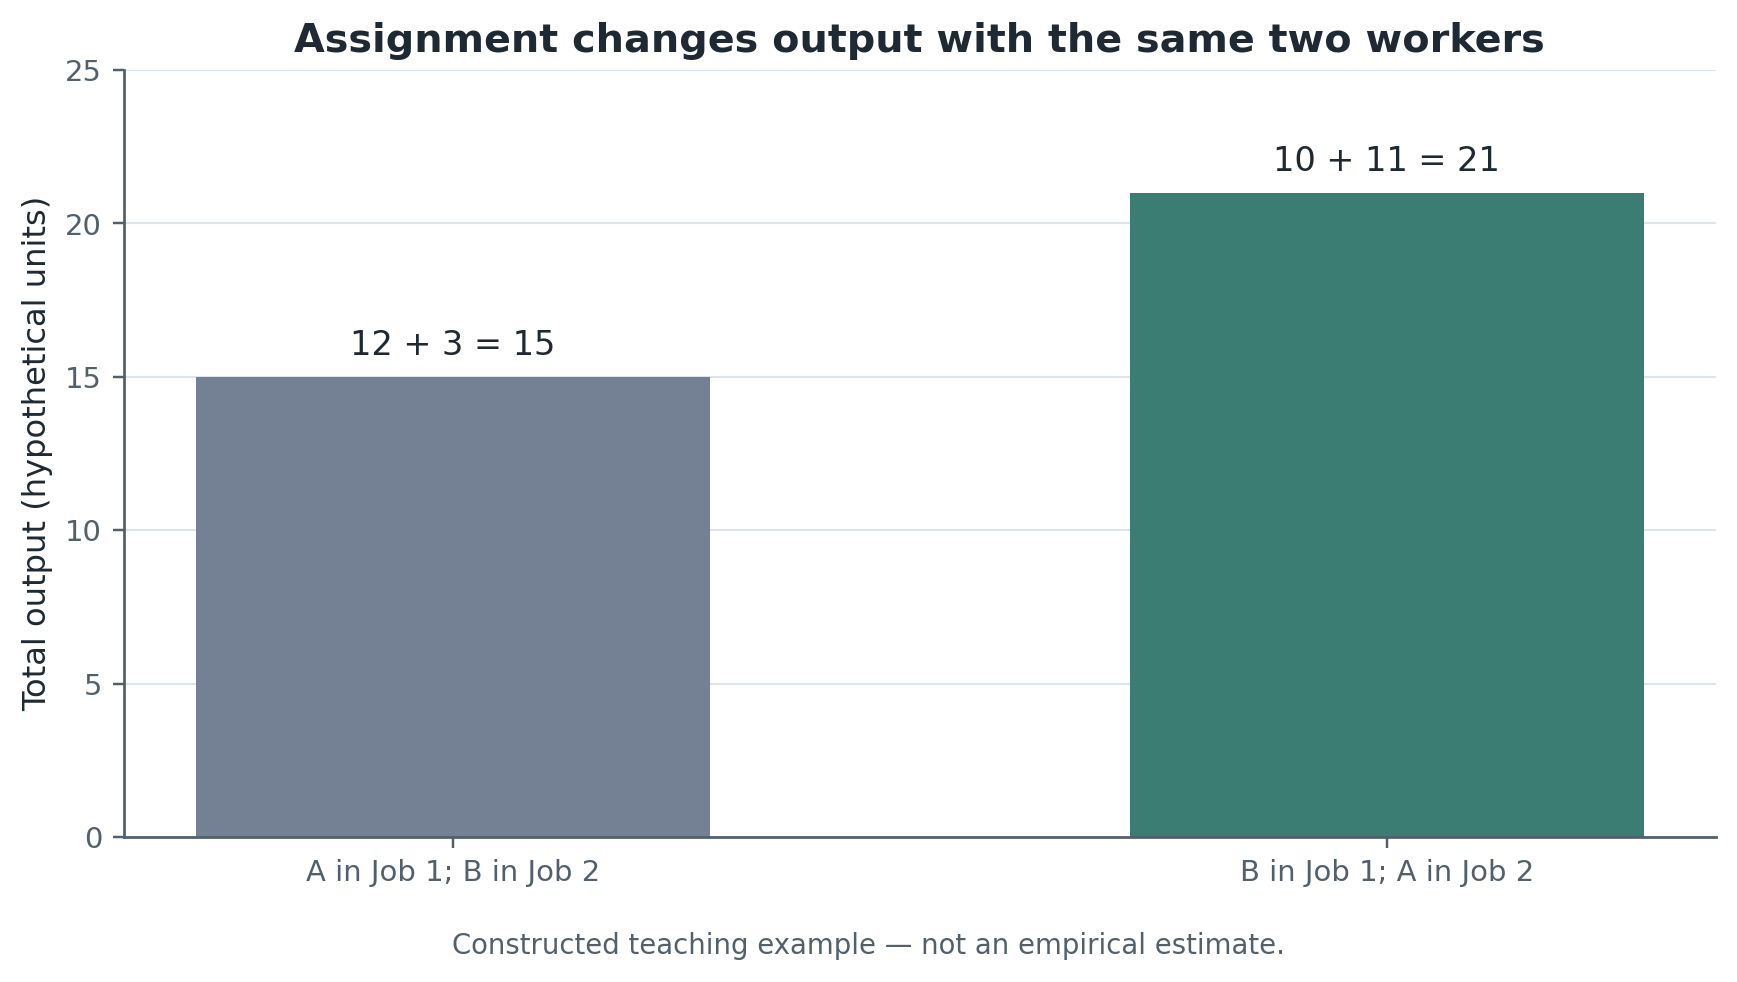
Figure 1:The same two workers produce different total output under different assignments. Values are constructed teaching primitives, not empirical estimates. The reproducible figure sums the four entries in the hypothetical output matrix.
In a larger organization the benchmark is
The binary indicator assigns worker to job ; is that match’s output value and job capacity. The constraints permit at most one job per worker and respect each job’s capacity. The values need not be observed, and current assignments reveal only a subset of potential worker–job outcomes. This is why an assignment question is also a measurement and identification question. Predicting performance in the current job does not reveal performance in an untried role.
Benson, Li, and Shue compare current sales performance, promotion decisions, and subsequent managerial performance Benson et al., 2019. The study is useful here because it separates the employee’s present job from the job into which that person is promoted. Do not interpret the result as proof that any promotion based on performance is irrational: promotion may simultaneously allocate talent and provide incentives. Week 6 will examine that tradeoff in depth.
Haegele’s study provides a newer organizational friction: managers’ incentives to retain strong workers can inhibit internal applications and talent allocation Haegele, 2026. Week 1 uses this to motivate the distinction between team objectives and organization-wide objectives; it does not attempt the full identification argument reserved for the internal-mobility week.
4. Incentives, selection, and measurement are different explanations
Suppose average recorded output rises after a change in pay. At least four explanations deserve attention: incumbent workers change effort; the firm attracts or retains different workers; tasks or customers are reassigned; or the recording system changes. Learning and technology can add further channels. A raw before–after mean does not distinguish them.
Lazear’s Safelite study links a move toward piece rates to productivity and workforce selection Lazear, 2000. Shearer’s tree-planting field experiment changes compensation for workers observed under both schemes Shearer, 2004. Read them together as contrasting routes to the effort-versus-selection question. The experiment narrows selection concerns for its experimental comparison; it does not make its environment representative of all jobs. The observational reform captures a broader organizational response but needs additional discipline to separate mechanisms.
A useful accounting exercise decomposes a change in average output. Let be the distribution of observed worker types under regime , and their mean outcome. On a common, well-defined support,
Here denotes the regime, observed worker type, and the regime’s mean output. The first term holds the baseline composition fixed; the second changes composition at regime-1 outcomes. This is an accounting identity, not an identified decomposition of effort and selection. The within-type change can still include changing task difficulty, shocks, and unmeasured selection. Reversing the reference distribution can change the allocation between components.
Practical implication: keep entrant, stayer, mover, and leaver records distinct. Do not interpret a balanced panel of survivors as the full policy effect. Do not code a missing performance review after exit as zero productivity. Also do not omit exit just because output is missing: retention is itself an outcome.
5. The measurement problem: what is the number actually measuring?
Output per paid hour, completed tasks, defect rates, supervisor ratings, earnings, and customer satisfaction are not alternative labels for a single latent quantity. Each records a different part of production or reward. A time-use log may measure activity rather than value; a sales total may reflect the territory assigned; a rating may contain information and incentives; a wage may include rents, insurance, compensating differentials, and institutional pay rules.
Use a simple measurement distinction:
The performance measure and the pay rule are separate objects. Here converts output, quality, and difficulty into a recorded assessment; is measurement error, and is compensation. An organizational intervention can change either measurement or pay. The equation does not license treating as classical noise; evaluator bias, strategic reporting, and selective observation may make it nonclassical.
Gibbons and Holmström–Milgrom motivate why rewarding a measurable task can redirect effort away from valuable but poorly measured work Gibbons, 1998Holmström & Milgrom, 1991. Week 1 draws the measurement implication: collect at least one outcome that is not simply the target the organization rewards. Week 4 will develop the incentive model.
For each paper, students should prepare a measurement card: unit, timing, denominator, producer of the record, incentive to manipulate it, missingness rule, and the claim it can support. For example, performance among retained workers and retention among all initially assigned workers have different denominators. Reporting both does not automatically identify performance for those who exited.
6. Managers, teams, and systems: what is hidden in a worker residual?
Lazear, Shaw, and Stanton use worker–supervisor productivity data to study the contribution of bosses Lazear et al., 2015. Hoffman and Tadelis connect manager assessments to employee attrition and manager rewards Hoffman & Tadelis, 2021. These papers justify observing the supervisor and worker relationship rather than assigning all unexplained variation to worker ability. Their findings do not imply that every manager quality score is causal or that a supervisor has the same effect in all production environments.
A descriptive panel specification might be
Here is a measured outcome, a worker effect, a manager effect, and a job-by-time effect. The index identifies the unit receiving the rule change, its exposure indicator, an exposure coefficient, and a residual. Worker effects account for fixed worker differences; job-by-time effects address some task/time conditions. A causal interpretation still needs an argument about manager assignment and reform timing. Manager changes after declining performance can generate misleading patterns. Sufficient worker–manager mobility and connected comparisons are needed even to separate additive effects; fixed effects cannot be recovered independently when identifiers are perfectly nested. A one-firm sample also cannot identify between-firm effects.
Mas and Moretti use detailed workplace output and coworker exposure to study peer effects Mas & Moretti, 2009. Use the paper to ask what coworkers can observe and how interactions occur. A team average is not a sufficient description of peer exposure when visibility, task dependence, and interaction timing matter.
Some organizational practices may be complements. The steel-line evidence in Ichniowski, Shaw, and Prennushi studies systems of human-resource practices Ichniowski et al., 1997. The management field experiment in Bloom and coauthors studies a package of practices Bloom et al., 2013. Neither setting licenses attributing a bundled effect to every component independently. This is the empirical counterpart to asking whether a training program needs supervisor support or an incentive scheme needs reliable measurement.
7. What detailed organizational data add to inequality research
For log wages , the law of total variance gives
Here is worker ’s employer and the log wage. The identity separates between-employer mean differences from within-employer dispersion, using a clearly stated worker-weighted population. It does not separate productivity, rents, sorting, discrimination, or compensation for amenities. Changing the weighting to equal firm weights changes the statistic.
Song and coauthors’ published study of earnings inequality distinguishes within-firm and between-firm changes and emphasizes worker composition Song et al., 2019. The teaching lesson is not that internal labor markets are irrelevant whenever between-firm differences are important. Internal recruitment, training, promotion, and retention can shape who ends up at which firm. Conversely, within-firm dispersion need not come entirely from internal policy.
The new course complements, rather than replaces, matched employer–employee research: broader administrative data describe population patterns; rich personnel data can reveal a decision that generates some of those patterns. Neither dataset automatically supplies the counterfactual missing from the other.
8. Five research designs students should recognize
Organize empirical work by the variation, not by the prestige of the dataset.
A descriptive personnel-panel design can establish career patterns and reject simplistic descriptions of how a firm works. Baker–Gibbs–Holmström is the reference point. The limitation is causal attribution: promotion and pay decisions are chosen.
A within-firm policy change can connect a rule to outcomes, as in the performance-pay literature. Students must ask why the timing changed, what else changed, and whether the workforce or task mix changed. A regression with many controls does not answer these questions automatically.
A worker–manager or worker–team transition design exploits changes in relationships. It needs a story for why reassignment is informative rather than a response to unobserved performance shocks. Plot transitions, preserve event timing, and inspect whether both old and new managers have comparable workers.
A randomized organizational intervention can identify the effect of an offer or rule in its implemented environment. Bloom and coauthors’ management experiment is an example; the hybrid-work study supplies the Week 1 lab Bloom et al., 2013Bloom et al., 2024. The assignment unit, spillovers, take-up, and follow-up process remain part of the design.
A choice or survey-linked design can measure preferences or beliefs that administrative records do not contain. Mas–Pallais and Hoffman–Tadelis illustrate different uses of such information Mas & Pallais, 2017Hoffman & Tadelis, 2021. Survey answers are measurements, not automatically revealed preferences; choices with stakes still depend on the available menu and the participating population.
Table 2:Paper-based routes from organizational questions to evidence
| Paper | Question and evidence | Design lesson | Limitation to carry into a new project |
|---|---|---|---|
| Baker et al., 1994 | Personnel histories reveal hierarchy, careers, and compensation. | Build the internal job and transition structure before explaining it. | Descriptive organization is not causal proof of optimality. |
| Lazear, 2000 | A compensation reform changes output and workforce composition. | Separate response by incumbents from the composition of workers observed. | Timing, tasks, and selection are part of the design. |
| Shearer, 2004 | Workers experience experimentally varied compensation. | Within-worker experimental comparisons sharpen the incentive margin. | Experimental tasks and conditions limit transport. |
| Bloom & Van Reenen, 2007 | Management interviews create comparable practice measures. | A constructed index requires an explicit rubric and survey protocol. | Cross-firm correlations are not randomized returns to management. |
| Bloom et al., 2013 | A management intervention is experimentally introduced. | Define the package, implementation, and treatment unit. | A bundle does not identify every component’s contribution. |
| Lazear et al., 2015 | Worker output is linked to supervisors. | Observe assignments and mobility, not only manager labels. | Endogenous assignment and weakly connected comparisons can matter. |
| Hoffman & Tadelis, 2021 | Survey-based people skills are linked to personnel outcomes. | Combine otherwise unobserved management attributes with administrative records. | Ratings, selection, and common sources of measurement need scrutiny. |
| Benson et al., 2019 | Promotions connect performance in different roles. | The best worker and best prospective manager are different targets. | Promotion incentives can rationalize some assignment tradeoffs. |
| Haegele, 2026 | Personnel records and surveys reveal talent-hoarding behavior. | Connect the manager’s objective to workers’ internal applications. | The application margin is not the whole internal allocation problem. |
| Bloom et al., 2024 | A hybrid-work offer is evaluated with multiple outcomes. | Define retention, reviews, promotion, and satisfaction separately. | Outcome samples and a particular implemented schedule constrain interpretation. |
| Brynjolfsson et al., 2025 | A tool rollout is linked to work performance. | Observe actual workplace use and outcomes, not only occupational exposure. | A particular rollout does not identify aggregate AI employment effects. |
9. A personnel-data workflow that students can actually start
Begin with an organizational decision and request the smallest data structure that could distinguish its mechanisms. An initial specification should include a stable worker ID; employment spells; the timing of job, team, and manager assignments; pay components; outcome timestamps and definitions; and records of policy eligibility and actual exposure. Add rejected applications, training opportunities, or outside offers only when the question needs them. “All HR data” is not a design.
Preserve assignment histories rather than joining outcomes to the employee’s latest manager. Treat firms, establishments, and teams separately. Reconcile calendar time, payroll periods, and event time. Document the first date each field became reliable. A new dashboard can create apparent performance growth simply by recording more events.
Public and restricted resources offer different starting points. The WMS provides questionnaires and public data pathways, but identified or panel releases have additional conditions and a download-maintenance notice was visible when this pack was prepared. Census MOPS provides public documentation and aggregate tables; these are not an unrestricted worker-level panel. IAB’s LPP links employer and employee perspectives through controlled-access products. O*NET provides occupation-level descriptions, not employee performance records World Management Survey, n.d.U.S. Census Bureau, n.d.Institute for Employment Research, Research Data Centre, n.d.National Center for O*NET Development, n.d.. The resource map records these distinctions so students do not design a project around nonexistent access.
Table 3:Resources, access conditions, and limits to organizational measurement
| Resource | Useful for | Practical access route | Limit that must be stated |
|---|---|---|---|
| Bloom et al., n.d. | A bounded organizational experiment and outcome ledger | Public Dataverse release V1.1, under CC BY 4.0; selected files and original code inspected for this lab | Use each outcome file’s documented population. Files are anonymized and split; do not reconstruct identities or infer cross-file join keys. The lab records version and file hashes. |
| World Management Survey, n.d. | Practice definitions, survey design, cross-organization comparisons | Public questionnaires and data pathways; separate terms for identified/panel data | A download-maintenance notice was visible. Do not promise immediate download or unrestricted identifiers. |
| U.S. Census Bureau, n.d. | Establishment-level management questions and aggregate benchmarking | Public questionnaires/tables/documentation; protected microdata are a separate route | Public aggregate tables are not personnel microdata and cannot identify worker–manager relationships. |
| Institute for Employment Research, Research Data Centre, n.d. | Employer and employee perspectives on HR practices and job quality | Research Data Centre application and controlled access | Not an open teaching dataset. No promise of instant access or arbitrary record linkage. |
| National Center for O*NET Development, n.d. | Occupation descriptors, task/context vocabulary, crosswalk design | Public versioned database with documentation and attribution terms | Occupation averages are not employee effort, firm policy, or person-specific preferences. |
| Firm HR, applicant systems, and production logs | Assignment histories, decisions, direct workplace outcomes | A specific research partnership and approved data agreement | Coverage begins where the firm’s systems begin; rejected applicants, informal work, or departures may be unobserved. No partner access is assumed. |
Resource identities and access distinctions were checked in the supplied materials on 20 September 2026; the lab also records its inspection of the official experimental release. Preserve downloaded release/version metadata; access can change. Suggested survey and linkage extensions are research proposals, not assertions of available linked files.
For research partnerships, agree on the research question, data custody, confidentiality, publication review limited to disclosure issues, and the treatment of null findings before analysis. Do not release employee identities, raw communications, proprietary records, or inferred sensitive attributes in a teaching repository. This is a research-workflow recommendation, not a substitute for institutional review or a data agreement.
10. Why a one-firm study can be broadly informative—and where it stops
The aim is not to prove that a particular firm represents the economy. It is to explain why the setting reveals a mechanism and which features govern whether that mechanism travels. A workplace with individually recorded output, stable teams, and standardized tasks may be informative about monitoring or peer pressure; its magnitudes need not transfer to creative project work with diffuse output.
Require a short portability statement for every empirical paper: production technology; workers and jobs observed; outside options; organizational rule; compliance and implementation; and outcomes missing from the study. A multi-firm sample widens coverage but does not erase selection into participation or observation. A single firm with many workers can provide rich variation without supplying many independent organizations.
The same distinction matters for frontier work. Generative AI at Work studies a particular technology introduction and its workplace outcomes; it does not estimate the economy-wide employment effect of AI Brynjolfsson et al., 2025. Talent hoarding is evidence about a specific internal allocation friction, not proof that all internal labor markets are blocked Haegele, 2026. Week 1 should teach students to formulate these limits as part of the scientific contribution rather than as an apologetic closing paragraph.
11. Research opportunities: ask which organizational margin is missing
The following are proposed research directions, not claims that the literature is empty.
From screening to careers. Hiring data often stop at entry, while personnel data begin with hires. Linking the funnel to later assignments, training, and exits could show when screening selects productive workers and when organizational support changes the meaning of early signals. The starting reference is Discretion in Hiring; the new question must specify the outcome missing from that design Hoffman et al., 2018.
From manager ratings to managerial actions. A manager effect can summarize teaching, task allocation, or retention. Combining outcomes with time-stamped decisions can separate those mechanisms. The design must address why managers undertake the measured action, not only whether the action predicts performance Lazear et al., 2015Hoffman & Tadelis, 2021.
From one employee’s career to colleagues’ opportunities. A promotion or delayed exit can change the positions available to others. Bianchi and coauthors provide an application of career spillovers Bianchi et al., 2023. A new study could measure the vacancy, internal application, and training margins behind such adjustment rather than assume they are all displacement.
From tool adoption to organizational adaptation. Ask whether the intervention changes delegation, training, communication, or task division, and whether those changes persist. The unit of inquiry is the organizational response, not a generic claim that AI raises productivity Brynjolfsson et al., 2025.
From firm gains to joint incidence. A practice can change turnover costs, employees’ schedules, workloads, and future opportunities. Collect outcomes that make conflicting effects visible. Neither a profit increase nor a quit reduction alone is a welfare calculation.
Each proposed project should finish this sentence: “The existing design observes ___; my design adds ___, allowing us to distinguish ___ from ___.”
Research Lab
Primary paper and purpose
The primary lab anchor is Bloom, Han, and Liang (2024), Hybrid Working from Home Improves Retention without Damaging Performance. This week uses the experiment to audit organizational units, outcomes, and measurement; Week 9 develops the full work-design discussion. The article identifies a public data-and-code repository at DOI 10.7910/DVN/6X4ZZL Bloom et al., 2024Bloom et al., n.d.. The lab records the inspected release, terms, file hashes, and definitions so that each reported result can be traced to its inputs.
Reproduce
The lab offers two explicitly separate paths. Mode A re-estimates one retention contrast and one performance-review contrast from inspected official-release files. Its Python adapter follows the documented comparisons; it does not execute the full original Stata/R analysis. Document the experimental sample, assignment, treatment offer, and outcome window before interpreting either result. Preserve the official anonymization and file splitting rather than attempting to reconstruct employee identities or join keys.
Mode B, the guaranteed offline path, reconstructs the published rounded retention contrast: control quits of 7.2% and treatment quits of 4.8% imply a −2.4 percentage-point difference and a one-third relative reduction. Label the result “published-statistic reconstruction; not microdata replication.” These rates are published inputs, not newly estimated quantities. This path produces no estimated standard error, p-value, confidence interval, or group counts.
Diagnose
Prepare an outcome ledger distinguishing quit rates, satisfaction, performance reviews, promotions, and task output. Identify the relevant sample and missingness for each. Explain why an intention-to-treat contrast differs from the effect of actual home-working days. Explain why no detected difference is not a proof of exact equality. The paper’s review-score equivalence tests use bounds of ±0.5 grade points on a five-point scale. Evidence that a difference lies within those bounds is a claim about that margin, not an exactly zero effect. It also does not recover unobserved reviews for workers who left Bloom et al., 2024.
Use the research question to interrogate portability: this treatment is a particular hybrid schedule in a particular organization. It is not a generic treatment of “remote work.” Do not translate a treatment subgroup’s significance and another subgroup’s nonsignificance into a significant treatment-effect difference without a direct test.
Transfer
Use a small, explicitly synthetic personnel panel to study a hypothetical organizational policy. Hold average output changes fixed while varying worker selection and incumbent productivity. Compare repeated-cross-section output, stayer output, entry, exit, and a task-quality measure. Students should see how identical headline productivity gains can imply different mechanisms. The synthetic data are not calibrated estimates of the primary paper.
The challenge reading is The Value of Bosses: redesign the data ledger for a manager-transition study and explain why the same outcome table does not supply the same identification argument Lazear et al., 2015.
Submit the outcome ledger, a result with its reproduction mode stated, the synthetic scenario comparison, and a transfer memo. The runnable handout below specifies the files and checks.
Methods Box
Table 4:A practical methods box for the opening lecture
| Situation | Start with | Required implementation detail | What this does not fix |
|---|---|---|---|
| Mapping internal careers | Job-level taxonomy and transition matrix | Define job vs grade; separate internal transfers, promotion, entry, and exit; use eligible denominators | Endogenous allocation or selection into the firm |
| Comparing workers’ output | Task-adjusted descriptive distributions | Common units, paid vs productive hours, task difficulty, quality, and missingness | Latent effort and unmeasured task assignment |
| Evaluating a compensation reform | Explicit pre/post assignment and selection map | Retain leavers/entrants; compare stable worker/task cells; document concurrent changes | Nonrandom timing or changes in unmeasured conditions |
| Estimating manager effects | Worker–manager spells and transition support | As-of joins; connectedness; predecessor/successor comparisons; pre-move paths | Sorting, regression to the mean, or common team shocks |
| Studying an experimental rule | Assignment-based effect with all assigned units | Distinguish offer from use; identify randomization unit; show follow-up and spillovers | External validity, arbitrary mediation claims, or unobserved post-exit outcomes |
| Using survey measures | Explicit rubric and administrative validation | Timing before outcomes, independent coding where feasible, nonresponse ledger | Social desirability, common-method bias, or strategic answers |
| Comparing practices across firms | Clear sampling frame and within/between description | Definition consistency, weights, industry/task mix, benchmark population | Causal returns from cross-sectional correlations |
Paper templates: Baker et al., 1994Shearer, 2004Lazear et al., 2015Bloom et al., 2013Hoffman & Tadelis, 2021Bloom & Van Reenen, 2007. Inference follows the design and dependence structure, not whichever standard-error option is convenient.
What belongs here, rather than in a methods course? The practical connection between organizational records and the comparison. Students should know the assignment unit, outcome denominator, measurement process, transition support, and dependent observations. They should not be told that a method name makes a design credible.
If a policy is randomized at the firm or team level, individual records do not become independent treatment assignments. If workers move between managers, dependence and identifying comparisons must reflect that structure. If the measured practice and the outcome are both chosen, controls and clustered standard errors do not repair the missing causal argument. Detailed inference derivations can be assigned from the Empirical Methods course; this box makes their organizational relevance explicit.
Reading Ladder And References
Use this chapter for one extended lecture or two shorter meetings. The required framing and one rotating discussion paper form the common workload; the remaining references support deeper inquiry and later weeks.
Required framing: Lazear–Shaw; the introduction, productivity, and external-validity portions of Hoffman–Stanton; Baker–Gibbs–Holmström as the original personnel-data example. Read the primary lab paper’s design, outcome definitions, and data-availability sections Lazear & Shaw, 2007Hoffman & Stanton, 2025Baker et al., 1994Bloom et al., 2024.
Required rotating discussion: assign one of The Value of Bosses or Talent Hoarding in Organizations to half the class each; compare their decision-makers, data, and counterfactuals Lazear et al., 2015Haegele, 2026. This preserves a manageable required load while making current research visible.
Model and measurement pathway: Gibbons, 1998Holmström & Milgrom, 1991Lazear, 2000Shearer, 2004Bloom & Van Reenen, 2007Ichniowski et al., 1997.
Managers, careers, and interaction pathway: Benson & Shaw, 2025Hoffman & Tadelis, 2021Benson et al., 2019Mas & Moretti, 2009Bianchi et al., 2023.
Scale, entry, work design, and frontier pathway: Song et al., 2019Hoffman et al., 2018Bloom et al., 2013Mas & Pallais, 2017Brynjolfsson et al., 2025.
Table 5:Week 1 reading roles and boundaries
| Role | Reading | What students should extract | Deeper treatment later |
|---|---|---|---|
| Foundations | Lazear & Shaw, 2007 | Personnel questions as economic choices | Revisited throughout |
| Current field map | Hoffman & Stanton, 2025 | Selected sections on productivity, research approaches, and portability | Entire course reference, not an all-at-once assignment |
| Managers’ roles | Benson & Shaw, 2025 | Distinguish managing people and projects | Week 5 |
| Original personnel-data lens | Baker et al., 1994 | What the internal records reveal before causal modeling | Week 6 |
| Incentives versus selection | Lazear, 2000Shearer, 2004 | Compare which response the design can isolate | Week 4 |
| Contemporary allocation friction | Haegele, 2026 | Manager and firm objectives can diverge | Week 6 |
| Primary lab | Bloom et al., 2024Bloom et al., n.d. | Measurement ledger, assignment, denominators, replication mode | Week 9 owns the full work-design debate |
| Challenge lab | Lazear et al., 2015 | Transfer the ledger to a nonrandom manager-transition setting | Week 5 |
| Student output | One-page design memo and auditable lab outputs | Decision → mechanism → data → comparison → incidence | Week 10 capstone |
Exercises And Discussion Prompts
Solve the two-worker assignment example and check Figure Figure 1. What extra observations would be needed to learn comparative advantage from observed assignments rather than from the supplied hypothetical matrix?
A firm’s output per worker rises after a bonus reform. Write three observationally compatible mechanisms and one additional outcome or comparison that would help distinguish each.
Construct a measurement card for sales, a supervisor rating, and a quit indicator. For each, state the denominator, the observation process, and one claim it cannot support.
A manager changes just after a team misses its target. Explain why an event-study recovery in performance may not identify managerial quality. Propose a better source of variation and the records it needs.
Write a portability paragraph for one required empirical paper without claiming that its firm is representative.
Draft a one-page project: decision-maker; rule; worker response; firm and worker outcomes; data; comparison; principal threat; and one result that would falsify the proposed mechanism.
Reproducibility And Code Lab Note
Download the teaching repository (ZIP), or clone the repository. Keep its folder structure and open books/special-topic8-organizational/labs/01-the-firm-as-a-labor-allocation-system/; the lab README supplies the run instructions. Weeks 1–3 use the shared plotting module supplied with the repository.
The Week 1 lab handout guides Reproduce, Diagnose, and Transfer. Its folder is labs/01-the-firm-as-a-labor-allocation-system/. Run the guaranteed offline path from that folder:
ENV_NAME=research bash smoke.shIt reconstructs published rounded statistics, builds a separate synthetic personnel panel, and checks the arithmetic, observation states, comparison support, and reproducibility of the generated outputs. It requires no live download or credentials. Read each output’s provenance label: published statistics, official-release estimates, and constructed teaching data support different claims. Keep raw employee records and restricted data outside the public repository.
The assignment figure is generated independently with:
conda run -n research python assets/scripts/build-week1-assignment.pySlide Companion Note
The Week 1 slide deck (PDF) follows the assignment example, measurement distinctions, paper comparisons, and research lab. It highlights the economic logic and essential equations; the chapter supplies the fuller reading pathways. The Beamer source lives alongside the PDF at slides/week1/01-the-firm-as-a-labor-allocation-system.tex.
Bridge Forward
Week 2 opens the recruiting process: whom the firm sees, how it screens, and which candidates enter. The framework established here will keep those questions connected to post-hire assignment, learning, performance, and retention rather than treating recruitment as an isolated prediction exercise.
- Lazear, E. P., & Shaw, K. L. (2007). Personnel Economics: The Economist’s View of Human Resources. Journal of Economic Perspectives, 21(4), 91–114. 10.1257/jep.21.4.91
- Hoffman, M., & Stanton, C. T. (2025). People, Practices, and Productivity: A Review of New Advances in Personnel Economics. In Handbook of Labor Economics (Vol. 6, pp. 729–818). Elsevier. 10.1016/bs.heslab.2025.07.005
- Benson, A., & Shaw, K. (2025). What Do Managers Do? An Economist’s Perspective. Annual Review of Economics, 17, 635–664. 10.1146/annurev-economics-082222-073303
- Baker, G., Gibbs, M., & Holmström, B. (1994). The Internal Economics of the Firm: Evidence from Personnel Data. The Quarterly Journal of Economics, 109(4), 881–919. 10.2307/2118351
- Hoffman, M., Kahn, L. B., & Li, D. (2018). Discretion in Hiring. The Quarterly Journal of Economics, 133(2), 765–800. 10.1093/qje/qjx042
- Benson, A., Li, D., & Shue, K. (2019). Promotions and the Peter Principle. The Quarterly Journal of Economics, 134(4), 2085–2134. https://www.nber.org/papers/w24343
- Mas, A., & Pallais, A. (2017). Valuing Alternative Work Arrangements. American Economic Review, 107(12), 3722–3759. 10.1257/aer.20161500
- Haegele, I. (2026). Talent Hoarding in Organizations. American Economic Review, 116(8), 3110–3151. 10.1257/aer.20220264
- Lazear, E. P. (2000). Performance Pay and Productivity. American Economic Review, 90(5), 1346–1361. 10.1257/aer.90.5.1346
- Shearer, B. (2004). Piece Rates, Fixed Wages and Incentives: Evidence from a Field Experiment. The Review of Economic Studies, 71(2), 513–534. 10.1111/0034-6527.00294
- Gibbons, R. (1998). Incentives in Organizations. Journal of Economic Perspectives, 12(4), 115–132. 10.1257/jep.12.4.115
- Holmström, B., & Milgrom, P. (1991). Multitask Principal-Agent Analyses: Incentive Contracts, Asset Ownership, and Job Design. The Journal of Law, Economics, and Organization, 7(Special Issue), 24–52. 10.1093/jleo/7.special_issue.24
- Lazear, E. P., Shaw, K. L., & Stanton, C. T. (2015). The Value of Bosses. Journal of Labor Economics, 33(4), 823–861. 10.1086/681097
- Hoffman, M., & Tadelis, S. (2021). People Management Skills, Employee Attrition, and Manager Rewards: An Empirical Analysis. Journal of Political Economy, 129(1), 243–285. 10.1086/711409
- Mas, A., & Moretti, E. (2009). Peers at Work. American Economic Review, 99(1), 112–145. 10.1257/aer.99.1.112