Week 10. Frontier Questions, Personnel Data, and Student Research Designs
Learning Objectives
By the end of this capstone, students should be able to:
Turn an organizational decision into a labor question with a defined population, treatment regime, outcome, horizon, and comparison.
Distinguish an identified intervention effect from a mechanism interpretation, a structural parameter, and a prediction for another firm.
Explain the benefits and limits of studying one organization, several partner organizations, and a broader establishment sample.
Map a personnel-data request to the records that decisions actually produce, including eligibility, nonparticipation, exits, and measurement changes.
Build a realistic data-access, validation, inference, confidentiality, and reproducibility appendix.
Defend a small, substantive frontier project using a research memo rather than a list of fashionable tools or datasets.
Opening Orientation
The course began by opening the firm: workers, jobs, managers, rules, and teams need not be compressed into a single production unit. It ends by opening the research process. A large employer offers access to payroll and performance records; what question can these records answer? A randomized intervention improves a score; what does that establish about production or welfare? A study is internally persuasive; what should readers learn who do not work in that occupation, country, or organization?
The central question is what makes a study within an organization informative about a broader economic mechanism? The answer is not a requirement to find a representative firm before doing research. Nor is it a license to attach a universal interpretation to any interesting local result. The task is to connect the decision, variation, measurement, and claim—and to show where the connection stops.
This week is a research workshop supported by literature. It does not reteach every estimator or replay nine weeks of results. Students leave with a feasible memo plus data-access and validation appendix, not an obligation to have completed a publishable paper. Empirical depth matters more than the number of techniques named.
Core Points
Bridge
Weeks 1–9 repeatedly separated objects that are easy to conflate: selection and effort; signals and production; managers and assignments; training and promotion slots; peer exposure and own treatment; retention and outside opportunities; adoption and sustained implementation. Week 10 turns these distinctions into a common proposal architecture. Earlier readings return only when they teach a new capstone lesson—for example, the population targeted by an experiment, the information required for transport, or the records needed to distinguish two mechanisms.
Consider two establishments with effects of one and nine units and initial employment of 900 and 100. Their equally weighted establishment effect is five, while their initial-worker-weighted effect is . Neither is a computational mistake: they answer different population questions. A proposal must choose its unit and weights before interpreting its coefficient.
Field Core
1. From an organizational puzzle to an economic contribution
Begin with a choice someone can make: a screening rule, a feedback recipient, a bonus schedule, authority to move a worker, access to a training opportunity, the allocation of mentoring time, or a communication channel. Ask which labor margin should respond and what alternative explanation could generate the same observed pattern.
The field map in Hoffman and Stanton connects personnel practices to productivity differences and directly addresses the generalizability of within-firm evidence Hoffman & Stanton, 2025. Ichniowski and Shaw’s insider-econometrics approach explains the value of learning how a production process actually works before estimating the effect of a management practice Ichniowski & Shaw, 2009. These are complementary starting points: institutional knowledge can improve identification and measurement, but proximity to an organization does not itself make assignments exogenous.
A useful proposal opening has three sentences:
The decision is ____. Existing evidence cannot separate ____ from ____. The setting makes that distinction observable because ____.
Compare two original proposal openings:
Topic without a design: “We have employee dashboards and will study whether AI improves productivity.” This does not define the intervention, the outcome, or the population observed after adoption.
Research question: “A firm is introducing an optional writing assistant while reviewers remain capacity constrained. We will distinguish faster drafting from more completed, independently audited cases by tracking access assignment, drafting time, review queues, defects, and the original eligible workforce.” This is still a proposal: it requires a defensible assignment comparison and sufficient observations. But it names evidence that could discriminate between mechanisms.
A theoretical lens can identify an overlooked comparison even without a full structural model. Write
Here denotes production, pay, and a specified organizational regime, not the researcher’s eventual label for “good management.” The arrows are hypotheses to investigate. A diagram does not identify them, and estimating the total effect of does not separately identify every arrow.
2. Freeze a claim ledger before choosing the estimator
Use one ledger with seven fields: decision-maker; initially eligible population; assigned regime and control regime; measured labor outcomes; horizon; identifying comparison; supported claim. Add a second column stating what is not identified. Record whether the unit is a worker, application, vacancy, team, establishment, firm, or decision episode.
A contract reform may be randomized by establishment, implemented by managers, received by workers, and evaluated using millions of transactions. Those are four different units. Event timestamps, assignment identifiers, and exposure records determine how the objects can be connected. More transaction rows do not supply more independently randomized firms Cameron & Miller, 2015.
For worker at organization , define the horizon- outcome under regime and peer environment as . A source-population effect is
where denotes participating organizations and is the eligibility set fixed before assignment. This notation forces several choices: whether the effect concerns assignment or receipt, whether leavers remain in the population, and whether peers’ treatment is held fixed. The expectation here weights initially eligible workers; an establishment-weighted effect is a different object. It is not a claim that every design identifies this exact parameter.
If the actual randomization changes peer exposure, use a policy-regime contrast rather than silently labeling it an own-treatment effect at fixed . If retention is an outcome, workers who leave belong in the initial denominator. If production ceases at departure, separate cumulative production for the employer from production at a later employer, which may be unobserved.
The claim ladder is useful:
Table 1:Claims and the additional evidence they require.
| Level of claim | Additional evidence required |
|---|---|
| A variable changed | Valid measurement and a defined denominator |
| An assigned regime changed an outcome | Credible assignment comparison, exposure definition, and inference |
| A particular mechanism generated the effect | Distinguishing predictions or mechanism-specific variation; not only a mediator regression |
| A model parameter is recovered | Restrictions linking observables to the primitive, identification, and sensitivity |
| Another organization would benefit | Target definition, relevant contextual overlap, intervention comparability, and a portability argument |
| The reform improves welfare | Resource costs, transfers, worker conditions, distribution, horizon, and relevant spillovers |
This is an accounting of evidence, not a ranking of methods or a publication hierarchy.
3. One observed effect can have several explanations
Suppose an employer’s average recorded score rises by ten units after a reform. Consider three original, observationally equivalent explanations: each continuing worker improves; low-scoring workers leave; or the recording system adds ten to unchanged output. A regression using only average recorded scores cannot distinguish them.
A useful decomposition keeps a fixed initial population and splits outcome concepts rather than pretending to identify a mechanical causal decomposition:
where is the recorded metric, actual production, quality, and the measurement rule; is recording noise. The reform may affect any argument, the rule itself, or observation probabilities. Even a randomized reform effect on is not automatically an effect on .
In a proposal, require one primary outcome and at least one outcome with a different failure mode. Examples include completed cases and an independent quality audit; internal applications and independently documented eligibility; retention and confidential worker follow-up. Multiple dashboards produced by the same logging pipeline are not necessarily independent validation.
Applied template. Bloom, Han, and Liang evaluate a specified hybrid-work option with retention, satisfaction, and several performance outcomes Bloom et al., 2024. Revisit the paper as a claims exercise: identify which outcomes have equivalence analyses, which rely on ordinary comparisons, and when the control group’s later access changes the contrast. Do not interpret all nonsignificant results as evidence of no harm, all measures as productivity, or assignment to an option as identical attendance.
A contrasting template. Emanuel and Harrington distinguish treatment and selection in remote work using call-center records and a change in the work environment Emanuel & Harrington, 2024. Their treatment, worker population, and comparison differ from a randomized hybrid option. Contrasting the studies is valuable precisely because the titles “remote work” do not define an identical intervention.
Students should be able to explain why differing results need not conflict before proposing a meta-regression to reconcile them. Remote versus hybrid work, experienced versus new workers, quality versus quantity, and crisis versus planned implementation are substantive distinctions, not nuisance labels to remove.
4. Why a one-firm paper can matter—and what it cannot promise
There are at least four defensible ways to contribute from a selected setting. A paper can document a previously unobserved decision process; distinguish competing mechanisms; estimate a local causal effect; or identify a model primitive under explicit restrictions. A universal treatment effect is not the admission ticket to personnel economics.
At the same time, a finding in one organization is not automatically portable because the mechanism has a familiar name. A manager’s ability to block applications, a team’s capacity to review work, and a firm’s pay-setting rules may be essential to the effect. Record these features as scope conditions.
A useful external-validity statement takes this form:
The estimate concerns initially eligible workers facing regime A rather than B over horizon H. The proposed mechanism should also operate where constraints C and D are present. Its magnitude could change with E; the current study does not identify that change.
This is more informative than either “only one firm” or “the mechanism is universal.” It tells a reader what to look for in the next setting. Haegele’s evidence on talent hoarding, for example, motivates examining managerial incentives and access to internal openings, not exporting a single firm’s application effect to all internal labor markets Haegele, 2026.
The appropriate next study may be a deliberately contrasting organization rather than a larger version of the original one. Choose the second setting because it varies a proposed effect modifier—slot scarcity, centralized hiring, measured interdependence, or worker bargaining options. A difference across settings still needs a design to establish why the effects differ; selecting contrasting sites does not randomize their institutions.
5. Research partnerships are a selection process
Draw the sequence firms in the relevant economy → firms reachable by the researcher → firms willing to partner → sites eligible for implementation → workers observed at baseline → workers with follow-up outcomes. Each arrow can select on a different variable. A randomized treatment within participating sites does not randomize these earlier arrows.
Allcott studies selection in the adoption and evaluation of energy-conservation programs across utility sites Allcott, 2015. The important capstone lesson is the distinction between valid within-site comparisons and predictions for later sites. This is a methodological comparison, not personnel-data evidence or a randomized experiment on willingness to partner.
Translate the lesson into a personnel-data question: are employers more willing to share records when adoption was easy, baseline management was unusually strong, or early results were favorable? These are hypotheses to document, not facts to presume about any partner. Where permitted, retain a recruitment log with broad eligibility, contact stage, response, timing, and reasons for nonparticipation. Do not publish identifying refusal information without permission.
DellaVigna and Linos compare a comprehensive set of trials in two implementing organizations with published academic evidence DellaVigna & Linos, 2022. The exercise motivates asking which unsuccessful pilots and null results are absent from a firm’s “success stories.” It is not random assignment to scale, and its statistical decomposition is not a universal correction factor for personnel experiments. Use the published version rather than an earlier abstract with different decomposition language.
Site selection, selective publication, and selective worker follow-up must not be collapsed into one “selection problem.” They call for different records, assumptions, and remedies. A complete pilot registry helps document which trials were run; it does not supply outcomes for employees who were never surveyed or effects in unrepresented firms.
6. An intuitive model of portability: what reweighting can buy
Let contain measured, pretreatment effect modifiers, including relevant worker and organizational attributes. Let denote the source population and the target population. Fix the same unit and weighting convention in both populations; the following example and lab weight establishments equally within each population. Post-treatment implementation or usage is not a pretreatment modifier to put into . Under a common intervention, compatible outcomes, adequate overlap, and conditional mean-effect stability,
The first equality is an identifying assumption about effect transport, not a result of balance. Equal baseline outcomes and stable treatment responses are logically distinct assumptions: neither implies the other. Similar job titles alone do not establish stable effects. Source identification is still needed. With source support covering the target,
Original numerical example. Suppose high-support sites have an average treatment effect of eight units and low-support sites an effect of two. The selected source contains two-thirds high-support sites, while the target contains one-quarter. Here support means implementation resources, not statistical overlap: both contexts are represented in the source. The source effect is six; the target effect under stability is . The target-to-source density ratios are 0.375 for high-support sites and 2.25 for low-support sites. The numbers are invented and are not estimates from Allcott or a personnel paper.
Reweighting changes the population, not the original causal contrast. In a twelve-site illustration with eight high-support and four low-support sites, the weight-based effective sample size is
This is a weight-concentration diagnostic, not a replacement for counting independent assignments. The lab has six randomized pairs, not twelve independent treatment assignments or 6.737 inferential clusters.
A failure reweighting cannot fix. Suppose implementation changes in the target so that the two conditional effects are five and minus one. Its true effect is then . Using the source effects still predicts 3.5. Perfect balance on the recorded type cannot repair unrecorded treatment-version or contextual changes. The lab exports this as a separate instructor-only scenario, not an empirical diagnostic that can discover the unobserved effects.
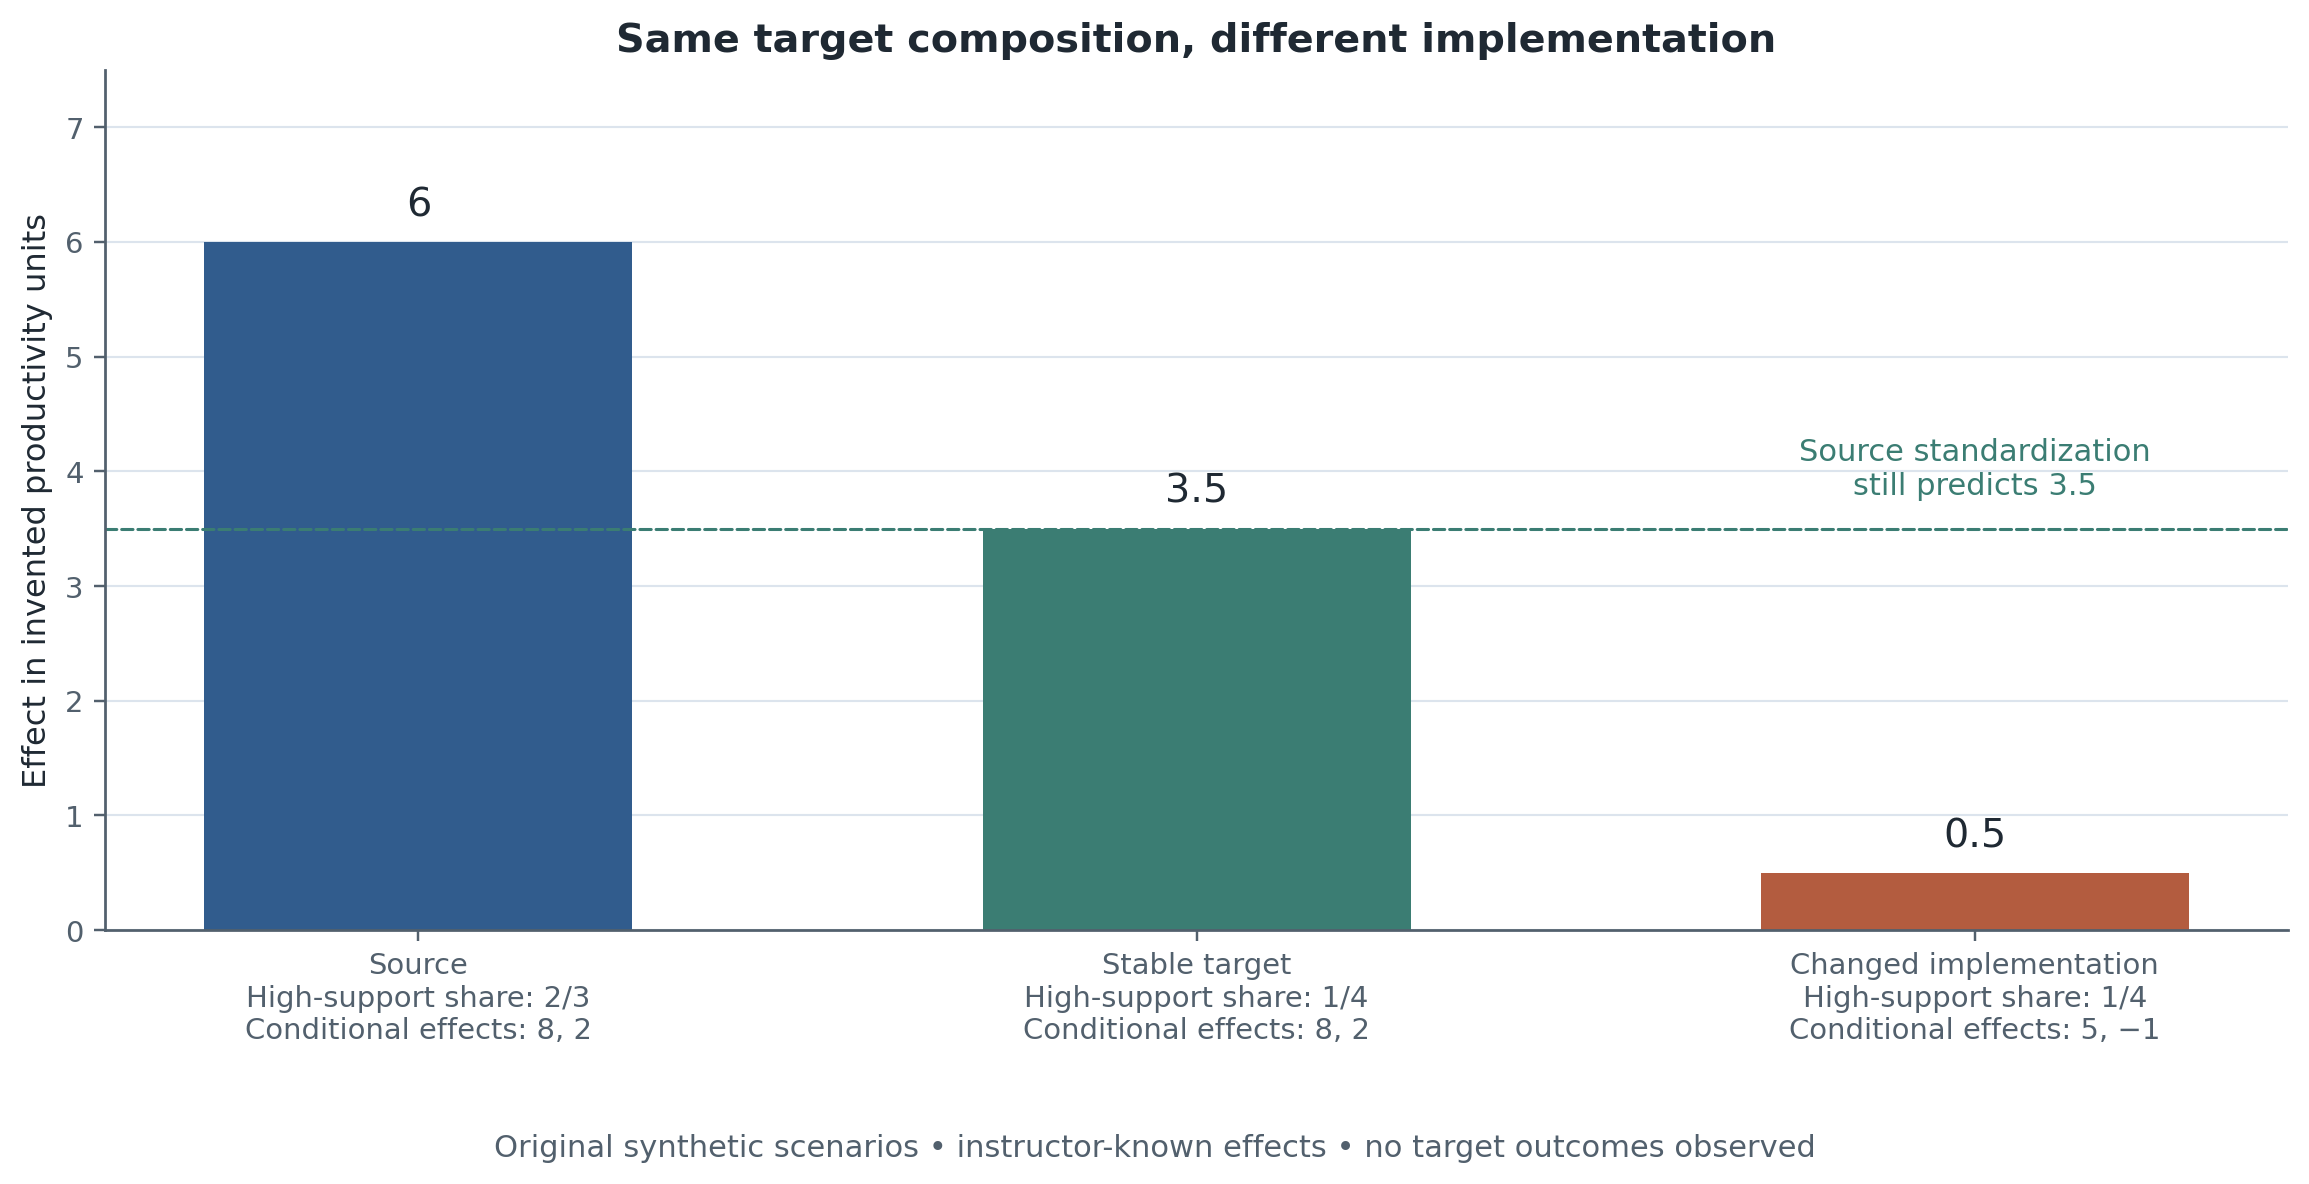
Figure 1:Original synthetic transport scenarios. These are instructor-known population effects, not estimates from one assignment. Both targets have the same observed composition, but only the stable scenario shares source conditional effects. The target frame contains no outcomes; the changed-world effect is stipulated for teaching. Read the exact scenario CSV and plotting script.
Hotz, Imbens, and Mortimer are a useful applied reference because their training-program comparisons separate population differences from differences in treatment components Hotz et al., 2005. Matching untreated outcomes across places does not establish equal treatment responses.
Absent support. If twenty percent of the target belongs to a context absent from the source, do not extrapolate silently. Suppose the supported-target effect is 3.5 and the unsupported effect is assumed only to lie between minus twenty and five. Then the whole-target effect lies in . This is an identification range conditional on invented bounds, not a confidence interval. Its endpoints are only as credible as those bounds. A smaller target population can be the honest answer.
Vivalt documents heterogeneity across impact evaluations and its relationship to study characteristics Vivalt, 2020. Use it to motivate explicit modifiers and uncertainty about a new site, not a claim that an observed site characteristic causally explains a difference. A precise pooled mean does not imply that a new organization’s effect is precisely known.
7. Multi-firm data: more coverage, different blind spots
Multiple firms can add variation in institutions, replication of a common intervention, and a wider sampling frame. They can also add incompatible software, outcome definitions, selected partners, and different treatment versions. Ask whether the additional firms improve the target population, the identifying variation, or only the number of rows.
Bloom and Van Reenen develop a way to measure management practices across establishments and countries Bloom & Van Reenen, 2007. Bloom and coauthors’ later Census collaboration illustrates a much broader establishment-based measurement design Bloom et al., 2019. The teaching distinction is between measuring dispersion, associating practices with productivity, and using particular variation to investigate drivers. A management score’s explanatory share is not the fraction of productivity causally improved by installing the score’s components.
An employer–employee linked survey can connect management practices to worker conditions, but linkage and survey response create their own populations. Administrative earnings panels can observe career outcomes after a move, yet may not observe the firm’s internal applicant pool, rejected ideas, review quality, or informal authority. A commercial job-history panel may describe reported transitions without observing all employees or the employer’s decision process.
Use the data map below to choose what is feasible rather than assuming a perfect combined dataset.
Data access and validation: separate what exists from what is accessible
Table 2:Data access and validation: separate what exists from what is accessible.
| Route | Usable research object | First feasibility check | Validation or inference issue | Access status and fallback |
|---|---|---|---|---|
| Partner personnel records | Eligibility, offers, contracts, assignments, pay, mobility | Ask for schema, version history, row unit, identifier logic, and a synthetic sample | Missing rejected candidates, selective exits, changing metrics | Permission-specific; no access presumed. Start with a mock schema and explicit missing-object list |
| Operational logs plus audit | Timing, case completion, defects, rework | Do logging rules change with the intervention? | Activity is not value; audit selection may be endogenous | Only permitted records; use an independently sampled validation audit |
| Worker survey linked to employer data | Conditions, beliefs, well-being, voice | Who is invited, responds, and can decline safely? | Differential response; confidentiality; leaver follow-up | Approved collection and linkage required; report bounded outcomes where appropriate |
| WMS World Management Survey, n.d. | Management-practice measures across establishments | Review public-data coverage, instruments, weights, and terms | Comparability and response; not complete worker histories | Official public-data and methodology pointers plus separate special access; no microdata run here |
| Census MOPS U.S. Census Bureau, n.d. | Establishment practices and published statistics | Match survey universe, wave, and definition to the question | Selected universe; broad correlations are not causal practice effects | Public documentation/statistics are distinct from restricted establishment microdata |
| IAB LPP / LPP-ADIAB Institute for Employment Research, Research Data Centre, n.d. | Employer and worker perspectives, optional administrative linkage | Compare catalogue version, required fields, linkage population, access route | Survey response and linkage; sampling strata; granularity | Research access requires its own process. Campus File is for learning data handling; the provider excludes substantive inference/publication |
| Bloom–Han–Liang archive Bloom et al., n.d. | A possible published-study replication exercise | Inspect actual files, version, terms, and named empirical object | Reproduce the design and endpoints, not only one table | Original article lists repository; pointer checked, contents/programs not executed here |
| DellaVigna–Linos supporting files DellaVigna & Linos, 2022 | A possible evidence-base comparison exercise | Check archive variables and analysis scope | Study-level selection and treatment comparability | Publisher lists Data and Programs; not downloaded or run here |
| Synthetic capstone lab | Code, estimands, missing-support and transport logic | Confirm no latent truth enters student estimators | Synthetic validity is not external validity to real firms | Fully offline, standard library, no credentials or permissions needed |
The source pack records official-resource checks on 22 September 2026; the local verification ledger distinguishes newly checked pages from inherited records. Requirements and versions must be checked again when a real project starts. This table does not promise access, substitute for ethics/data-use approval, or authorize automated data collection.
The World Management Survey provides public-data and methodology pointers as well as a separate special-access route World Management Survey, n.d.. Census MOPS documentation and published statistics should not be mistaken for unrestricted identified establishment data U.S. Census Bureau, n.d.. IAB’s catalogue distinguishes LPP survey data, administrative linkage, and a Campus File; these have different purposes and access conditions Institute for Employment Research, Research Data Centre, n.d.. The provider specifies that the LPP Campus File is for learning data handling and excludes substantive inference and publication from that teaching product; it is not a substitute for research-access microdata.
For a student without a firm partner, a useful first deliverable is an audit of a public instrument, a published statistic, or an available archive—not an invented proprietary-data replication. The supplied offline lab is guaranteed to run without applying for restricted access. Access to a live employer’s records is a separate project milestone.
8. What to ask an organization for—and what not to collect
A minimum viable request is built backward from the comparison. Specify records, keys, timestamps, and needed coverage rather than asking for “all HR data.” Request a schema or synthetic example before sensitive rows. For an internal-mobility project, the first indispensable record may be the eligibility/opening ledger rather than the full payroll history. For a manager intervention, it may be dated reporting lines and the assignment mechanism.
The data-access appendix should contain a table with one row per needed object: owner; fields; economic meaning; time created; changes to definitions; linkage keys; baseline and follow-up coverage; expected missingness; sensitivity; access status; and a fallback. Mark each object as available and checked, permission pending, or not observed. Do not use “available” to mean “someone believes the firm has it.”
As a research-planning recommendation, discuss publication of null or unfavorable results, disclosure review, secure storage, permitted uses, retention/deletion arrangements, and researcher independence before collecting outcomes. Seek the appropriate institutional ethics and data-use review. This lecture supplies a checklist, not legal advice or permission to collect employee records. Employer cooperation is not a substitute for applicable worker protections and research approval.
Keep identifiers and linkage keys separate from analysis files where the approved environment allows. Avoid exporting free-text complaints, message contents, or unusual reporting-line combinations merely because names have been removed. Publish only permitted outputs after required review. Do not upload confidential records to an external coding assistant or model endpoint without explicit authorization for that processing.
The AEA’s policy is a useful current resource for planning data and code documentation American Economic Association, 2026. It does not authorize data sharing. A reproducibility package can document acquisition procedures, code, software, and restricted inputs; a synthetic companion can verify program flow. Neither recreates unavailable empirical evidence.
9. Build a design that can discriminate, not just estimate
A useful proposal identifies two mechanisms with different observable implications. Consider four original examples:
Information versus effort. Giving workers a private dashboard can change knowledge and motivation. Randomized access identifies an access effect; usage is post-assignment. A comprehension measure and an independent audit improve interpretation, but formal mediation requires additional assumptions or variation.
Access versus ability in promotions. Removing an approval step may expand applications without increasing anyone’s skill. Measure initial eligibility, applications, available slots, offers, and later independent outcomes. Comparing only eventual promotees conditions on a changed selection rule. Benson, Li, and Shue motivate separating performance in the old role from comparative advantage in the new role Benson et al., 2019.
Capacity versus incentives in organizational reform. A technology can reduce processing time while a fixed review queue prevents more completed work. A two-arm bundle identifies a package effect, not all interactions. Atkin and coauthors’ sequential technology and worker-incentive interventions illustrate the value of investigating adoption barriers without pretending every component was fully crossed Atkin et al., 2017.
Manager skill versus team assignment. A fixed-effect ranking can combine real contributions, sorting, and estimation noise. Reassignment evidence, independent worker skill measures, and task comparability matter. Weidmann and coauthors combine experimental manager–team assignment with separate selection and field-validation exercises; these evidence layers are not interchangeable Weidmann et al., 2026. Leave-out methods for variance components address particular estimation-noise problems, not nonrandom assignment in general Kline et al., 2020.
Before collecting data, list what outcome pattern would make each favored interpretation less plausible. A pattern can be consistent with several mechanisms; say so. Finding no independent quality measure is a limitation to report, not an invitation to rename activity “quality.”
10. Inference, sensitivity, and the feasible claim
A method is chosen to match variation and dependence. For randomized worksite access, preserve the actual assignment blocks and analyze assignment before endogenous usage. For staggered policy rollout, define treatment histories and valid control periods; a modern DiD estimator addresses certain heterogeneous-timing problems, not endogenous rollout or all treatment reversals Callaway & Sant'Anna, 2021. A nonsignificant pretrend test is not a certificate of parallel trends Roth, 2022.
A practical plan specifies primary outcomes, an adjustment strategy, a heterogeneity family, the treatment-assignment unit, and the number of independent units. Distinguish a sharp-null randomization test from a confidence interval for a heterogeneous average effect. Use design-based power simulations that reproduce assignment, serial dependence, and the planned estimator—not a calculator that treats transaction rows as independent employees.
Do not freeze every exploratory question prematurely. Separate confirmatory claims from explicitly exploratory mechanism searches, document amendments, and preserve the dates on which outcome information was seen. Olken discusses both the usefulness and costs of pre-analysis plans Olken, 2015. The capstone recommendation is to pre-specify the choices that could change the main claim while making room for discoveries that are labeled as such.
For missing outcomes, state what is observed and the assumptions behind any correction. Lee-type trimming bounds need monotone selection and target a particular principal stratum; they do not automatically recover welfare for the entire initial workforce Lee, 2009. A simpler bounded-outcome calculation can reveal how little the data establish without stronger assumptions. In an original example, treated follow-up is 50 percent with observed mean 70; control follow-up is 90 percent with observed mean 60. On a 0–100 scale, full-population means lie in and , so the treatment difference lies in . The observed difference of ten is not a sign-definite population effect.
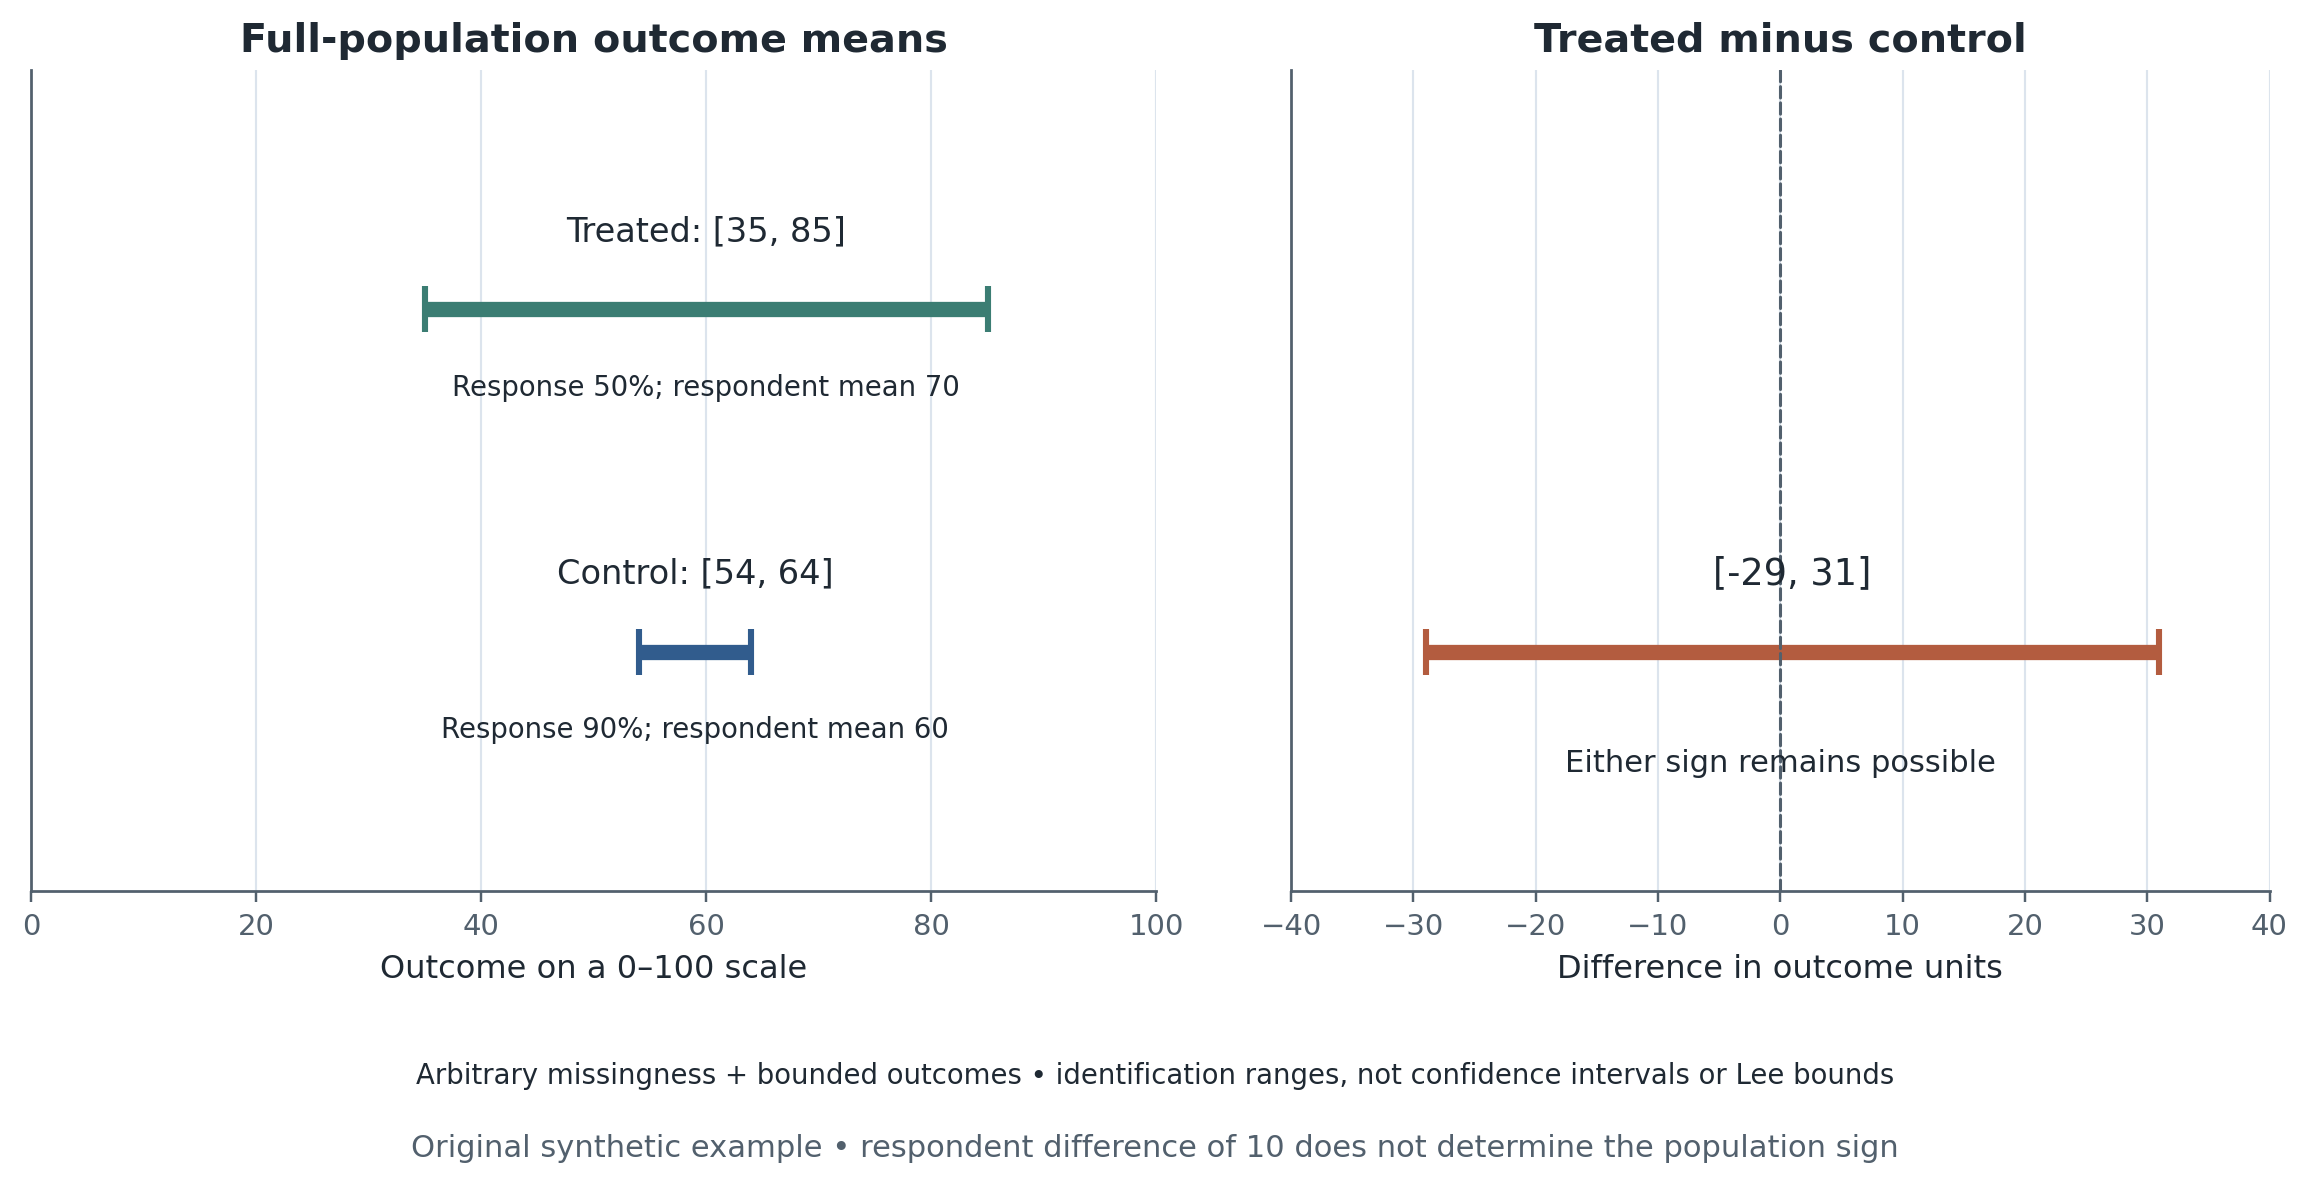
Figure 2:Original synthetic missing-outcome ranges. Response rates and respondent means imply possible full-population means under the stated outcome scale. The difference range includes either sign. These are identification ranges under arbitrary missingness, not sampling confidence intervals or Lee bounds. Read the exact bounds CSV; the plotting script checks the arithmetic.
When a structural calculation is needed, show which moments identify the primitive and how the policy output changes with that primitive. Andrews, Gentzkow, and Shapiro give a formal local sensitivity framework Andrews et al., 2017. Sensitivity of a fitted result to a moment is not an independent test of the identifying assumption. Do not require every proposal to add a structural model; a transparent reduced-form claim may be sufficient.
11. Worker welfare and the organizational objective
A reform can benefit the employer without benefiting every worker, and retention need not resolve that question. Define separately production value, resource costs, monetary transfers, work disutility, amenities, and effects outside the immediate unit. Keep speculative monetizations visible.
For an original monetary teaching example, suppose a reform raises verified output value by 12, requires 4 in setup resources and 2 in operating resources, and pays workers an additional 2. Suppose worker effort burden rises by 3 and an amenity is valued at 1. Within this deliberately restricted accounting boundary,
The payment of two is a firm cost and a worker receipt, not an extra resource cost in their combined total. The example assumes the stated valuations and omits taxes and external effects; it is not a welfare estimate. Do not add “incumbents” and “leavers” as disjoint groups when leavers are a subset of the initial incumbents.
Adhvaryu, Kala, and Nyshadham’s training study illustrates why productivity, promotion, wage, and retention effects deserve separate attention Adhvaryu et al., 2023. Caldwell and Danieli illustrate the additional modeling needed to summarize outside options rather than treating observed pay or quit rates as a complete opportunity measure Caldwell & Danieli, 2024. In a new project, specify what evidence could reveal worker gains even when employer records cannot follow post-exit welfare.
12. Where the field is—and five research opportunities
The following is a proposed agenda, not a claim that these questions are unstudied. The reviewed literature supplies ways to observe decisions and develop contrasts; it does not eliminate remaining measurement, partnership, or interpretation constraints. Choose a narrow contribution rather than claiming to solve “the future of work.”
A. Opportunity before application. Motivated by talent hoarding and promotion research, study who sees openings, who can obtain release, and which candidates never apply Haegele, 2026Benson et al., 2019. A possible design changes information or approval procedures among initially eligible workers, with openings and competition held in the estimand. The missing contribution is often access, not another estimate of the wage gain among promoted workers. Observe displacement when slots are fixed.
B. Information technology versus a reorganized job. Compare individual tool access with a coordinated change in review, task routing, or authority. Brynjolfsson, Li, and Raymond’s rollout evidence and Dillon and coauthors’ multi-firm randomized-access study motivate distinct task and work-pattern measures Brynjolfsson et al., 2025Dillon et al., 2025. The proposed contribution is to identify which organizational constraint changes—not to assume that time saved in an application is verified production or an employment effect. Observe versions, nonuse, and peer exposure.
C. The distribution of learning and coordination costs. Build an intervention that measures both recipients and experienced helpers. Emanuel, Harrington, and Pallais connect proximity to feedback and work outcomes using changes in colocation Emanuel et al., 2026. Their initial closure/feedback comparison and later return-to-office code-quality analysis are distinct evidence layers; feedback quantity, helper costs, and learning are distinct outcomes. A next design might alter mentoring schedules or credit rules. It would need task-quality audits, time costs, and later skill measures, not only messages sent. Selection into helping remains a central threat.
D. Voice, trust, and unrecorded worker costs. Use access to communication as a starting point, then distinguish channel availability from use, response, and resolution. Sotto Voce supplies an access intervention, not a separately randomized effect of using the channel Adhvaryu et al., 2026. A proposed extension independently audits underlying problems and worker follow-up. More recorded complaints could reflect safer reporting rather than more harm; any experiment must have an appropriate ethics and confidentiality plan.
E. Why the same reform travels differently. Deliberately select multiple organizations to test a measured implementation constraint, while separately defining the population the estimate represents. Allcott and the multi-firm management literature motivate attention to partner selection and contextual support Allcott, 2015Bloom et al., 2019. A multi-site study can be especially informative when it measures a common outcome independently and records the same intervention stages. Randomizing the reform does not randomize organizational context, so interpreting cross-site heterogeneity remains a separate task.
These questions connect organizational economics to labor demand, information, careers, inequality, and welfare. The contribution comes from a decision and a discriminating design, not the use of an AI dataset or a new estimator alone.
13. Course synthesis: what the ten weeks now enable
Course synthesis: a research decision, not a recap of results
Table 3:Course synthesis: a research decision, not a recap of results.
| Week | Organizational decision | Indispensable empirical object | Mistake the course teaches students to avoid | What enters the final memo |
|---|---|---|---|---|
| 1. Firm as allocation system | Which workers do which tasks? | Worker, job, manager, task, and outcome units | Treating a firm-level average as one mechanism | A decision-maker and a labor outcome |
| 2. Recruiting | Who is seen, evaluated, offered, and hired? | Dated candidate/vacancy risk sets and dispositions | Treating hired-worker outcomes as outcomes for all candidates | Initial eligibility and selection stages |
| 3. Measurement and learning | What signals are collected and used? | Raw production, quality, ratings, and information dates | Calling a better score higher ability or output | Independent validation and measurement versions |
| 4. Incentives | What is promised and paid? | Contract schedule, assignment, eligibility, payout | Regressing output on earned bonuses as an incentive effect | A treatment separate from receipt |
| 5. Authority | Who decides and who is assigned? | Reporting-line and decision-right histories | Treating a manager ranking as a causal contribution | Matching threats and decision rights |
| 6. Careers | Who can train, apply, move, or exit? | Openings, eligibility, applications, offers, starts, exits | Confusing skill gains with access or slot supply | Competing events and career denominators |
| 7. Teams | Who affects whose work? | Roster, interaction/exposure, joint output, helper costs | Calling all peer correlations complementarities | Spillover boundary and assignment unit |
| 8. Pay, options, voice | What makes workers stay or speak? | Pay components, opportunities, access/use/remedy, follow-up | Inferring welfare or monopsony from retention alone | Firm/worker incidence and unobserved outcomes |
| 9. Organizational change | What changes as a bundle and persists? | Component assignment, implementation, version, horizon | Treating bundle success as identified component complementarity | Treatment/control histories and transition costs |
| 10. Research design | What can this evidence establish elsewhere? | Source frame, target frame, permissions, validation, claim limits | Confusing internal validity, portability, and feasibility | Memo plus access/validation appendix |
These are pedagogical syntheses of the supplied course outline. They are not estimated findings or claims that the same estimator works in every week. Earlier content stays in its own chapter; Week 10 uses it to review a project.
The recurring design is not “collect performance data and control for fixed effects.” It is to connect a decision to a mechanism, define who is at risk of each event, observe alternatives and exits, measure outcomes with distinct failure modes, and match the causal claim to the available variation. Week 10 adds a target population, data feasibility, and an explicit limit to the claim.
The final seminar is a proposal workshop. Require a four-page memo plus a separate, concise access/validation appendix. A shorter feasible proposal is preferable to a long catalogue of hypothetical data. Present for eight minutes, receive five minutes of questions, and write a one-page response identifying one revision and one remaining limit. These are suggested teaching logistics, not prerequisites for the website build.
A reviewer should be able to ask: What decision changes? Who is initially eligible? What would happen without the change? Which records could distinguish the two mechanisms? Which observations are missing? What is the inferential unit? What population could the conclusion travel to? Who bears costs? What can be executed now?
There are three constructive outcomes: proceed with the scoped design, narrow the question or target population, or collect a missing comparison/measurement before claiming causality. No proposal should fail merely because it studies one firm, uses a familiar method, or produces a null effect. No proposal should pass merely because it has an experiment, a large dataset, or a prominent partner.
Research Lab
Primary design anchor and reproduction boundary
The principal design anchor is Allcott’s distinction between within-site identification and out-of-site prediction Allcott, 2015. Bloom–Han–Liang supplies a personnel-study claims audit; DellaVigna–Linos supplies a comparison of evidence bases Bloom et al., 2024DellaVigna & Linos, 2022. The guaranteed code exercise is original synthetic reconstruction, not a replication of any of these papers. No original microdata or estimation programs were downloaded or executed for this pack.
Reproduce
The offline lab creates twelve source establishments in six matched pairs: four high-support pairs and two low-support pairs. One establishment per pair receives a hypothetical reform. A separate target frame contains twenty establishments, one-quarter high-support. Students calculate pair differences, stratum effects, the source average, and a target-standardized effect from observed data. Both statistics estimate weighted source-establishment effects. The second becomes a target-population prediction only with compatible regimes and outcomes, overlap, and conditional mean-effect stability. Potential outcomes are fixed before a separate assignment draw; complete source outcomes and no source interference are explicit assumptions of this toy experiment.
The invented source-population truth is six units; the stable-target truth is 3.5. A realized estimate need not equal either. Instructor-only potential outcomes permit an exact audit of estimator properties, but they are not used by the student estimator or the sharp-null randomization test.
Diagnose
Enumerate all assignment vectors. Under the global source sharp null of no effect at every source establishment, hold observed adjusted outcomes and the predetermined target weights fixed. Report the randomization p-value for a source statistic and a target-standardized statistic. Neither p-value validates transportability or tests a standalone hypothesis about unobserved target effects.
For context , let be the mean observed pair contrast and its sample variance, with pairs. Predetermined context weights give
This uncertainty summary concerns source assignment, conditional on the fixed target weights. It does not measure uncertainty about unobserved target effects or justify a normal approximation from six pairs. The separate instructor audit recomputes outcomes across assignments and compares true design variance with the expected variance estimator. The estimator is conservative in expectation in this construction, but a single realized estimate need not exceed true variance. Oracle variance is not an empirical standard error. Discuss the strong concentration of target weight on only two low-support pairs. Then examine separate original examples of conditional effect shift, unsupported target contexts, selective worker follow-up, recording-only gains, transfer-versus-resource accounting, pilot-versus-rollout exposure, and in-sample selection of the best-looking site.
Transfer
Choose one of the proposed frontier questions and complete the supplied research-memo template. The appendix must contain a dated eligibility/event ledger, a minimal data request, a measurement-validation plan, an inference plan, a source-to-target comparison, worker/firm incidence, and an access fallback. Write one abstract sentence the proposed design could support and one tempting sentence it could not support.
A downloadable offline runner, full specification, four-page memo template, and review rubric accompany this chapter. Preserve observed, instructor-only, reproduced, diagnostic, and transfer outputs separately. Optional original-data reproduction requires verified archive contents, terms, and a named empirical object; a public link alone is not proof that all required inputs are accessible.
Methods Box
A usable proposal protocol
Fix the population and clock. Build the initial eligibility set before reading post-reform outcomes. Specify the event, anticipation, exposure window, and follow-up. Test joins, duplicate IDs, interval overlaps, and missing dispositions.
Write assignment separately from receipt. Name the randomized or quasi-experimental variation. Report access and usage as separate variables. Do not automatically divide an assignment effect by take-up or call receipt causal.
Choose a comparison, not just an estimator. Document the actual lottery, timing rule, threshold, or other design. Name the threats that the estimator does not solve.
Define two outcome families. At least one should be independent quality or worker conditions. Audit recording changes. State how exits, transfers, rejected applicants, and unobserved destinations enter denominators.
Count independent variation. Reproduce assignment blocks and interference boundaries. A six-pair design does not become a large experiment because it contains many employee days. Report the null used by any permutation calculation.
Separate transport from identification. Freeze the target frame and weighting target. Report support and weight concentration. Never estimate effect modifiers or tune target weights by choosing the most favorable result.
Bound what cannot be observed. Missing-outcome or unsupported-population ranges are conditional on explicit bounds. Do not relabel identification ranges as confidence intervals.
Document a reproducible feasible route. Classify access status for every required input, record versions, and preserve transformation code. A synthetic demonstration is evidence about software and logic—not the research finding.
Methods matched to the actual threat
Table 4:Methods matched to the actual threat.
| Threat | Useful action | What it can establish | What it cannot establish |
|---|---|---|---|
| Endogenous receipt after assignment | Analyze assignment first; document take-up | Effect of the offered regime under the design | A use effect without additional assumptions |
| Many rows, few assignment units | Cluster/design-aware analysis and a design-based power exercise | Uncertainty aligned with actual independent variation | Exogeneity, adequate power, or absence of spillovers Cameron & Miller, 2015 |
| Staggered rollout with changing effects | Specify cohorts, valid controls, treatment histories | Interpretable comparisons under the required assumptions | Parallel trends, arbitrary treatment reversals, or exogenous timing Callaway & Sant'Anna, 2021Roth, 2022 |
| Selected observed workers | Follow initial eligibility; bound missing outcomes where possible | A defined original-population effect or assumption-indexed range | All-worker welfare from a stayer-only regression Lee, 2009 |
| Selected firms with observed effect modifiers | Define target; standardize effects; inspect support | Target average under conditional stability and compatible treatment | Unobserved-context or intervention-version differences Hotz et al., 2005 |
| Unsupported target context | Narrow target or show explicit sensitivity bounds | What the supported data and added assumptions imply | Point identification for the absent context |
| Noisy manager/fixed-effect dispersion | Use noise-aware variance-component methods when applicable | Specific variance components under their assumptions | Random manager assignment or a universal ranking Kline et al., 2020 |
| A result driven by one model moment | Local sensitivity plus alternative justified specifications | Which restrictions/moments drive a parameter | Validity of those restrictions Andrews et al., 2017 |
| Mechanism inferred from a mediator | Separate assignment, use, and intermediate outcomes; design distinguishing contrasts | Total effect plus appropriately qualified mechanism evidence | A mediated causal effect from correlation alone |
| Favorable pilots selectively recorded | Ask for a full pilot registry and original outcomes | Scope of the observed evidence base | Effects at unobserved partners or missing workers DellaVigna & Linos, 2022 |
| Post-result specification decisions | Date plans/amendments; label exploration | A transparent analysis history | Protection from every source of bias Olken, 2015 |
| Confidential source cannot be shared | Document access, code, versions and allowed outputs | A traceable replication path with stated limits | Public microdata or empirical replication by synthetic files American Economic Association, 2026 |
Apply each correction only to the problem it addresses. “We used fixed effects, ML, and clustered errors” is not a substitute for explaining the source of identification.
Reading Ladder And References
Three required readings
Hoffman–Stanton (2025): selected synthesis and external-validity sections, not the full chapter. Use it to articulate a labor contribution Hoffman & Stanton, 2025.
Allcott (2015): identify the distinction between experimental efficacy within sites and predictions for a selected sequence of sites Allcott, 2015.
Bloom–Han–Liang (2024): revisit the methods, outcome definitions, limits, and availability statement as a complete claims audit rather than another hybrid-work lecture Bloom et al., 2024.
Focused companion discussions
Use Hotz–Imbens–Mortimer for population versus treatment-version differences; DellaVigna–Linos for evidence-base selection; Emanuel–Harrington for selection versus treatment and incomparable work arrangements; Bloom et al. (2019) for broad establishment measurement Hotz et al., 2005DellaVigna & Linos, 2022Emanuel & Harrington, 2024Bloom et al., 2019.
Research pathways and technical references
Each project selects one personnel anchor, one method reference, and one actual data/resource page. The table specifies these routes; the 28 scholarly entries are a reference bank, not 28 assigned papers. Version/status notes distinguish published work from specified working-paper revisions.
Papers as capstone design templates
Table 5:Papers as capstone design templates.
| Paper | Empirical or conceptual contribution used here | Capstone question | Limit to preserve |
|---|---|---|---|
| Hoffman–Stanton Hoffman & Stanton, 2025 | Review of personnel research and generalizability | What broader labor mechanism is learned? | A review is not new identification of each practice |
| Ichniowski–Shaw Ichniowski & Shaw, 2009 | Insider knowledge combined with empirical analysis | Which institutional fact changes the design? | Access and detailed knowledge are not exogeneity |
| Allcott Allcott, 2015 | Experimental effects within a selected sequence of sites | Why might later sites differ? | Site adoption/evaluation is not randomly assigned |
| Hotz–Imbens–Mortimer Hotz et al., 2005 | Comparison across training-program environments | Population change or treatment-component change? | Comparable controls do not prove common treatment responses |
| DellaVigna–Linos DellaVigna & Linos, 2022 | Comprehensive implementation evidence versus published studies | Which pilots enter the evidence base? | Comparison and decomposition are not a randomized scale effect |
| Vivalt Vivalt, 2020 | Heterogeneity across impact evaluations | Which modifiers predict differences? | Moderator associations need not be causal |
| Bloom–Han–Liang Bloom et al., 2024 | Specified randomized hybrid option and multiple outcomes | What does the full evidence package support? | Preserve population, option, horizon, equivalence endpoints, and crossover |
| Emanuel–Harrington Emanuel & Harrington, 2024 | Remote-work treatment/selection comparison | Are two apparently conflicting papers studying the same regime? | Not the same design as a randomized hybrid option |
| Bloom et al. Bloom et al., 2019 | Broad manufacturing-plant management measurement | What does multi-firm coverage add? | Descriptive explanatory power is not a causal installed-practice return |
| Benson–Li–Shue; Haegele Benson et al., 2019Haegele, 2026 | Promotion selection and access to internal opportunities | Is the missing margin ability or access? | Promotees are selected; opportunity supply and managerial incentives matter |
| Weidmann et al. Weidmann et al., 2026 | Experimental manager–team assignment plus distinct validation exercises | What evidence travels from a controlled task to work? | Do not pool experimental and field-validation claims |
| Emanuel–Harrington–Pallais Emanuel et al., 2026 | Proximity changes, feedback, and work outcomes | Whose learning benefit and opportunity cost is observed? | Code-quality evidence belongs to the return-to-office analysis |
| Brynjolfsson–Li–Raymond; Dillon et al. Brynjolfsson et al., 2025Dillon et al., 2025 | Within-workflow rollout and multi-firm randomized access | Tool, task, or organization-level change? | Rollout is not random; app time is not independently verified output |
| Adhvaryu et al. Adhvaryu et al., 2026 | Assigned access to voice technology | Does access itself matter? | Do not use access as a use-IV without addressing its direct effect |
| Andrews–Gentzkow–Shapiro Andrews et al., 2017 | Moment-to-parameter sensitivity | What empirical object drives the counterfactual? | Sensitivity is not validation of the model’s identifying restrictions |
For every paper, students name one reusable design move and one boundary. This is a comparison of evidence structures, not a ranking of publication outlets or an assertion that every study has the same estimand.
Reading ladder and capstone routes
Table 6:Reading ladder and capstone routes.
| Role | Anchor | Student task |
|---|---|---|
| Required synthesis excerpt | Hoffman–Stanton (2025) Hoffman & Stanton, 2025 | State the broader personnel/labor question and a credible scope condition |
| Required external-validity design | Allcott (2015) Allcott, 2015 | Separate within-site evidence, selected sites, and future-site prediction |
| Required applied claims audit | Bloom–Han–Liang (2024) Bloom et al., 2024 | Trace population, option, outcome, horizon, inference, and availability |
| Population/version comparison | Hotz–Imbens–Mortimer (2005) Hotz et al., 2005 | Identify what must be shared for transport |
| Evidence-base and heterogeneity comparison | DellaVigna–Linos (2022); Vivalt (2020) DellaVigna & Linos, 2022Vivalt, 2020 | Ask which results enter the sample and which differences are not randomized |
| Personnel contrast | Emanuel–Harrington (2024) Emanuel & Harrington, 2024 | Explain why apparently similar work-arrangement studies need not conflict |
| Wide versus deep data | Bloom et al. (2019); WMS; LPP Bloom et al., 2019World Management Survey, n.d.Institute for Employment Research, Research Data Centre, n.d. | Match coverage, fields, and access to the proposed claim |
| Frontier route: internal opportunity | Benson–Li–Shue; Haegele Benson et al., 2019Haegele, 2026 | Design around initial eligibility and slot competition |
| Frontier route: work-system adaptation | Atkin et al.; Brynjolfsson–Li–Raymond; Dillon et al. Atkin et al., 2017Brynjolfsson et al., 2025Dillon et al., 2025 | Distinguish tool access, complementary redesign, and realized production |
| Frontier route: development and helping | Training; proximity; manager measurement Adhvaryu et al., 2023Emanuel et al., 2026Weidmann et al., 2026 | Observe recipients, helpers, later skills, and assignment threats |
| Frontier route: conditions and outside options | Voice access; outside-options model Adhvaryu et al., 2026Caldwell & Danieli, 2024 | Separate access/use, retention, and worker welfare |
| Reproduce | Original synthetic selected-site experiment | Estimate source and target-standardized contrasts without instructor truth |
| Diagnose | Exact assignment audit plus original failure scenarios | Separate randomization uncertainty, transport assumptions, missing support, and welfare accounting |
| Transfer | Research memo, access appendix, claim review | Submit an executable next step and a claim the design cannot support |
The 28 scholarly references and six resource entries are a bank for projects, not a compulsory reading count. Do not reassign all previous weeks’ readings. Each student chooses one frontier route and the methodological follow-up actually needed.
Exercises And Discussion Prompts
Write a one-firm finding as a local effect, a mechanism hypothesis, and an out-of-firm prediction. What additional evidence does each step require?
Recalculate the source and target averages in the 8/2 example. Why does a precise source estimate not identify the shifted target effect of 0.5?
What can a registry of all a firm’s pilots solve? Name two forms of selection it cannot solve.
Design a validation outcome for an internal productivity score that changes definition during the reform.
A partner offers only records for retained workers. State a narrower estimand you could study, what you could not claim, and what additional follow-up would matter.
Compare an establishment-weighted effect with an employee-weighted effect. Which population does your project need, and how would post-reform headcount weights change it?
Evaluate the proposed context-transport assumptions for one frontier question. Name a meaningful second organization and a feature to measure before observing its outcomes.
Submit the research memo and access/validation appendix. A peer reviewer must identify the strongest supported claim, the largest unresolved threat, and the smallest useful next data collection.
Reproducibility And Code Lab Note
Download the teaching repository (ZIP), or clone the repository. Keep its folder structure and open books/special-topic8-organizational/labs/10-frontier-questions-personnel-data-and-student-research-designs/; the lab README supplies the run instructions. Weeks 1–3 use the shared plotting module supplied with the repository.
Use the Week 10 lab handout, lab README, full research memo, and proposal-review rubric. The guaranteed route is original synthetic design reconstruction, with empirical_replication: false. Its standard-library runner writes observed source records, a target frame, observed-data estimates, fixed-outcome sharp-null distributions, a separate instructor audit, diagnostics, and a short claim card linked to the full handouts. Every numerical example is invented.
Run from this book directory in the existing research environment:
ENV_NAME=research bash labs/10-frontier-questions-personnel-data-and-student-research-designs/smoke.sh
conda run -n research python assets/scripts/build-week10-research-design.py
Smoke runs all 67 supplied assertions, two fresh default-seed runs with identical manifests, seed 88771, Python compilation, observed-CSV-only parity, and exit-2 overwrite refusal with unchanged files. The generator accepts --out and refuses nonempty targets; safe staging preserves authored notes. The two figures read exact saved lab CSVs. No significance or equality of a realized estimate to truth is required.
Original empirical microdata and estimation programs were not downloaded or executed. Optional original-data replication remains NOT RUN and requires verified archive contents, terms, version, and a named result. Public documentation or a synthetic demonstration cannot establish empirical replication.
Slide Companion Note
The Week 10 slide deck (PDF) and Beamer source follow the final research seminar: claim ledger → competing explanations → one-firm contribution → partnership selection → transport and failure → data access → inference and incidence → five frontier designs → lab → memo defense. Technical and workshop appendices support the full memo and constructive review rubric.
Compile from this book directory:
conda run -n research latexmk -cd -pdf -interaction=nonstopmode slides/week10/10-frontier-questions-personnel-data-and-student-research-designs.texBridge Forward
The next step is the student’s own project—not an eleventh lecture. A strong organizational labor study uses institutional detail to make an economic question answerable. It says what changed, for whom, relative to what, through which plausible mechanisms, and at what cost. It also says what the evidence does not yet establish. That is how an informed within-firm study becomes a contribution to labor economics rather than only a report about a partner organization.
- Hoffman, M., & Stanton, C. T. (2025). People, Practices, and Productivity: A Review of New Advances in Personnel Economics. In Handbook of Labor Economics (Vol. 6, pp. 729–818). Elsevier. 10.1016/bs.heslab.2025.07.005
- Ichniowski, C., & Shaw, K. L. (2009). Insider Econometrics: Empirical Studies of How Management Matters (Techreport No. 15618). National Bureau of Economic Research. 10.3386/w15618
- Cameron, A. C., & Miller, D. L. (2015). A Practitioner’s Guide to Cluster-Robust Inference. Journal of Human Resources, 50(2), 317–372. 10.3368/jhr.50.2.317
- Bloom, N., Han, R., & Liang, J. (2024). Hybrid Working from Home Improves Retention without Damaging Performance. Nature, 630, 920–925. 10.1038/s41586-024-07500-2
- Emanuel, N., & Harrington, E. (2024). Working Remotely? Selection, Treatment, and the Market for Remote Work. American Economic Journal: Applied Economics, 16(4), 528–559. 10.1257/app.20230376
- Haegele, I. (2026). Talent Hoarding in Organizations. American Economic Review, 116(8), 3110–3151. 10.1257/aer.20220264
- Allcott, H. (2015). Site Selection Bias in Program Evaluation. Quarterly Journal of Economics, 130(3), 1117–1165. 10.1093/qje/qjv015
- DellaVigna, S., & Linos, E. (2022). RCTs to Scale: Comprehensive Evidence from Two Nudge Units. Econometrica, 90(1), 81–116. 10.3982/ECTA18709
- Hotz, V. J., Imbens, G. W., & Mortimer, J. H. (2005). Predicting the Efficacy of Future Training Programs Using Past Experiences at Other Locations. Journal of Econometrics, 125(1–2), 241–270. 10.1016/j.jeconom.2004.04.009
- Vivalt, E. (2020). How Much Can We Generalize from Impact Evaluations? Journal of the European Economic Association, 18(6), 3045–3089. 10.1093/jeea/jvaa019
- Bloom, N., & Van Reenen, J. (2007). Measuring and Explaining Management Practices Across Firms and Countries. The Quarterly Journal of Economics, 122(4), 1351–1408. 10.1162/qjec.2007.122.4.1351
- Bloom, N., Brynjolfsson, E., Foster, L., Jarmin, R., Patnaik, M., Saporta-Eksten, I., & Van Reenen, J. (2019). What Drives Differences in Management Practices? American Economic Review, 109(5), 1648–1683. 10.1257/aer.20170491
- World Management Survey. (n.d.). Survey Data, Questionnaires, and Access Information. https://worldmanagementsurvey.org/survey-data/
- U.S. Census Bureau. (n.d.). Management and Organizational Practices Survey: Data and Documentation. https://www.census.gov/programs-surveys/mops.html
- Institute for Employment Research, Research Data Centre. (n.d.). Linked Personnel Panel and LPP-ADIAB. https://fdz.iab.de/en/our-data-products/integrated-establishment-and-individual-data/lpp/