Week 5. Managers, Hierarchies, Authority, and Delegation
Learning Objectives
By the end of this week, students should be able to distinguish a manager’s identity from a worker–manager match, a reporting hierarchy, and an allocation of decision rights; interpret manager effects without automatically calling them causal skill; formalize the tradeoff between local information and conflicting objectives; explain why attention and escalation can constrain spans of control; compare experiments, rotations, personnel panels, and time-use data; and write a manager-transition research proposal with an explicit comparison, residual matching threat, and worker-welfare outcome.
Opening Orientation
Central question: What do managers contribute, and how should organizations assign authority and discretion?
An organization reports that performance improved after replacing a manager. What has it learned? The incoming manager may teach better, reassign tasks, obtain resources, screen new entrants, change who leaves, or change the reporting of performance. The firm may also have sent its best manager to a team already about to recover. Even when the improvement is causal, it need not be a portable property of the person: the manager may work especially well with that team, at that span of control, under those decision rights.
This week separates who manages, what managers do, and what they are authorized to decide. These are related but distinct research objects. A person can be effective under one organizational arrangement and ineffective under another; a delegation reform can matter without replacing anyone. The objective is to turn these distinctions into data requests, comparisons, and counterfactuals rather than adding “manager quality” as an unexplained residual.
The course outline assigns this week vertical authority, manager contributions, and worker–manager matching. The new literature and original teaching examples below develop that scope; they are not claims made by the outline. The guiding review is Benson and Shaw, which organizes management around concrete personnel and operational functions Benson & Shaw, 2025. The three required empirical readings provide a deliberately contrasting sequence: personnel-panel evidence, a field experiment changing authority, and a recent experiment assigning managers to teams.
Core Points
Bridge
Consider a service team that must resolve unusual customer requests. A new supervisor could improve performance by teaching staff to solve more cases, matching cases to the right worker, or obtaining faster approval from headquarters. The same output increase could come from each channel, but the needed evidence differs: comparable-task skill, task assignments, or approval timestamps. A worker may also face fewer delays but more intense work. Begin with the decision and the information available to each person, then follow both output and working conditions.
Week 3 separated production from measurement and employer learning. Week 4 studied how rewards attached to those signals change behavior. Here the focus is the manager as an input and decision-maker, and the hierarchy as an allocation of information and authority. Reuse the earlier measurement and incentive distinctions without reteaching the full lectures.
Week 6 will study training investments, promotion systems, and internal mobility in depth. Week 7 will study horizontal peer relationships and coordination. This week uses worker development and teamwork only to identify managerial channels. It does not turn into a second recruiting lecture, a generic leadership course, or a claim that all effective practices must be bundled into one index.
Field Core
1. Start with a manager and decision-rights ledger
Before estimating anything, reconstruct three linked records. The reporting ledger records worker, team, establishment, direct manager, higher-level manager, dates, acting appointments, concurrent assignments, and changes in reporting definitions. The decision ledger records who initiates, recommends, approves, can reject, and can appeal a decision, along with timestamps and resource constraints. The outcome ledger records quantity, quality, delay, customer or service outcomes, labor inputs, worker experiences, and exits.
A reporting change and an authority change are not interchangeable. A central approval requirement may disappear while the reporting chart is unchanged. Conversely, a new reporting line may leave budgets and vetoes at headquarters. “Decentralization” should be coded for an actual decision: scheduling, hiring, procurement, prices, task assignment, promotion nominations, or production changes. The cross-country organization survey in Bloom, Sadun, and Van Reenen is useful for seeing how task-specific authority can be elicited rather than inferred solely from job titles Bloom et al., 2012.
A practical unit is the worker–manager spell, but it is not always the analysis unit. A team-level intervention may require team-period outcomes; an approval reform may require a decision-level dataset; and a hierarchical redesign may operate at establishment or firm level. Record all units before joining them. A many-to-many merge can manufacture managerial reach by duplicating workers, decisions, or output.
For a manager with nominally 20 reports, ask whether those are full-time direct reports, intermittently supervised workers, heads of other teams, or workers shared with another manager. For decision delay, include proposals that were withdrawn or never approved. Measuring waiting time only for approved proposals can make a slow approval system appear fast because its difficult cases disappear.
Table 1:Manager roles and decision rights
| Object or role | Economic margin | Minimum useful records | Main interpretation trap |
|---|---|---|---|
| Manager identity | Contribution common across workers or tasks | Worker–manager spells, output, dates, site and task histories | A fixed effect is not automatically portable skill or a causal practice effect. |
| Worker–manager matching | Complementarity between person and team | Repeated assignments and independent baseline skills | A common ranking can hide comparative advantage and endogenous matching. |
| Teaching | Accumulation of worker capability | Comparable tasks, skill measures, exposure duration, post-departure outcomes | Persistence can also reflect durable assignment or resource changes. |
| Allocation | Matching workers to tasks, shifts, or jobs | Task recommendations, assignments, transfers, skill/task requirements | Controlling for realized assignments removes part of a total manager effect. |
| Selection and retention | Entry, exits, and workforce composition | Applicants, hires, voluntary/involuntary exits, hours, baseline cohort | Stayer-only comparisons and output-per-worker ratios change the population. |
| Coordination | Interdependent decisions and resource timing | Project stages, dependencies, decision logs, meeting content | More meetings can be an input, a symptom, or a bottleneck. |
| Formal authority | Right to propose, approve, veto, or appeal | Task-specific policy rules and effective dates | Fewer layers do not prove decentralized decisions. |
| Real authority | Who actually determines decisions | Initiation/override/approval trails, access to information | A formal delegation memo does not prove implementation. |
| Attention and span | Processing of requests and exceptional problems | Actual reports, queue entries, abandonments, priorities, service times | Observed request volume can fall when the queue is congested. |
| Information versus communication tools | Local resolution versus cheaper escalation | Recipient-specific access, use, requests, errors, time | A technology label does not reveal where decision-making moves. |
| Worker welfare | Autonomy, workload, security, and opportunity | Confidential surveys, hours, schedules, safety, mobility | Profit, retention, and welfare are distinct outcomes. |
2. What can a manager contribute?
A useful diagnostic—not a specification to estimate indiscriminately—is
Here indexes workers and periods; , , and identify the current site, manager, and task. The terms , , , , , and represent worker attributes, site conditions, time shocks, a common manager contribution, worker–manager complementarity, and task difficulty. Accumulated skill enters with coefficient ; contains other influences on output. The equation makes omitted mechanisms visible. It does not guarantee that all terms are separately identified. If managers never leave sites, site and manager effects are inseparable. If tasks change only when managers change, task and manager contributions need additional restrictions. If a manager develops worker skill, controlling for post-arrival skill removes a potential part of the total contribution.
This produces at least four distinct empirical targets: the effect of assignment to a particular manager; the effect of assignment under a selection rule for managers; the effect of changing one managerial practice; and the effect of changing decision rights. A manager fixed effect is not automatically any of the latter three. The matched-effects framework of Abowd, Kramarz, and Margolis is a useful statistical foundation, but its employer-effect application is not itself a causal manager-assignment design Abowd et al., 1999.
Original teaching example: comparative advantage among managers. Suppose expected team output under manager A or B is:
Table 2:Original teaching example: manager–team comparative advantage
| Team | Manager A | Manager B |
|---|---|---|
| Technical team | 14 | 12 |
| Customer-service team | 9 | 13 |
One manager per team yields total output 27 with A in technical and B in customer service, versus 21 under the opposite assignment. A’s advantage over B is +2 in one team and −4 in the other. A single ranking of managers obscures the matching problem. These are invented conditional outputs, holding staffing and resources fixed; the example does not identify such complementarities in actual data or establish a welfare-optimal assignment.
Lazear–Shaw–Stanton: a personnel-panel benchmark. The Value of Bosses uses worker output and supervisor assignments to estimate differences associated with bosses and investigate persistence in worker performance. It demonstrates why measuring people inside a firm can reveal variation that firm averages conceal. The research lesson is to examine who switches, which comparisons connect bosses, and how worker performance is observed. This is not random assignment of every boss to every worker, and the setting does not establish a universally transferable managerial trait Lazear et al., 2015.
3. Identifying a contribution rather than a favorable assignment
A manager-transfer event is attractive because the team may stay while its supervisor changes. But the appointment may respond to an impending product launch, employee departures, a temporary performance collapse, or an unobserved reorganization. Worker fixed effects absorb persistent worker differences, not these time-varying shocks.
Start with an assignment chronology: when the vacancy arose, when the replacement was decided, when staff learned about it, when the manager arrived, when resources or tasks changed, and when outcomes were measured. Appointment, announcement, and arrival can be different treatment dates. Do not automatically label departure of the previous manager as the onset of the incoming manager’s influence.
A coherent comparison is a transition between manager types versus another transition with a comparable departure and replacement event. In an illustrative event study, let H denote a higher ex ante manager score and L a lower score. Compare L→H with L→L; separately compare H→L with H→H. This is more informative than grouping every switch against every nonswitch because it can distinguish the quality contrast from generic disruption. Scores must be fixed using information that predates the focal team’s exposure, or constructed from independent data.
This diagnostic equation uses a common arrival date , with worker , team/event , calendar period , and reference event period . In the low-origin sample, denotes L→H and denotes L→L. Estimate a separate equation in the high-origin sample, where denotes H→L and denotes H→H; the two sets of need not be opposites. Calendar effects absorb the common event profile. Standalone event-time dummies would be collinear with them when all events occur at .
A causal transition interpretation requires no anticipation, parallel untreated changes within the defined origin-history comparison, and no relevant spillovers. Independently fixed scores avoid outcome leakage but do not establish these assumptions. Specify eligibility and whether a worker, team, or event receives equal weight. Different arrival dates require a separately specified stacked or calendar-time design with explicit comparison histories, overlapping-window rules, and risk sets. This is not a generic two-way-fixed-effects recipe for repeated switches. A nonsignificant pretrend does not establish exogeneity Roth, 2022.
Minni: rotation and allocation. The published 2026 paper links manager rotations to worker careers and productivity in a multinational firm. The ex ante high-flyer proxy is age at first promotion to middle manager. The main comparison uses workers’ first lateral-manager rotation, excluding manager promotions and worker-initiated team moves; these restrictions do not make every observed move random. The paper interprets persistent worker gains and movements across jobs as evidence for an allocation channel. For this week, concentrate on the assignment institution, the ex ante manager measure, and alternative explanations for persistence. The detailed economics of internal moves is reserved for Week 6. Use the published 11-year version, not older working-paper descriptions Minni, 2026.
Persistence is a discriminating outcome but not a unique mechanism test. Learning can persist after a manager leaves, but so can a better task assignment, a resource investment, a changed reporting practice, or selective retention. To argue learning, measure skill or performance on comparable tasks; to argue allocation, observe task changes and transfer destinations; to argue a resource mechanism, record budgets, capital, and staffing.
Weidmann and coauthors: experimental separation. This 2026 paper repeatedly assigns managers to teams in a preregistered laboratory environment and controls for individual task skill. It also studies managerial self-selection and uses two field-validation exercises. Treat these as separate evidence layers: randomized manager assignment identifies contributions in the experimental environment; measured skill predicting outcomes is not random assignment of that skill; field validation is not automatically a field experiment on managerial appointment Weidmann et al., 2026.
The selection component randomizes sessions between lottery assignment and a rule selecting participants with the strongest desire to manage. This identifies a contrast between selection rules, not the causal effect of acquiring a managerial skill. The separate predictive analyses relate measured characteristics to performance. The two field validations follow lab participants’ LinkedIn promotions and examine skill, sales, and rotations in a retailer; neither randomly assigns managerial appointments in the field. Keep the sample, outcome, and comparison attached to each evidence layer Weidmann et al., 2026.
The lab gives an unusually useful template for designing research: measure individual baseline skill, randomize who manages whom, retain repeated team assignments, and evaluate out-of-sample performance. External validity still requires asking whether actual managers face the same information, stakes, staffing constraints, relationships, and horizon. A strong controlled contribution is an important result without pretending it answers every organizational counterfactual.
4. Manager identity is not a unidimensional productivity index
Hoffman–Tadelis link worker-reported people-management skills to personnel outcomes in a technology firm. Their evidence emphasizes attrition and examines new hires and supervisor switches. The important teaching contrast is that better people management need not improve every measured performance outcome in the same way. Survey scores require attention to response selection, the timing of measurement, and whether workers’ experiences influence both their ratings and subsequent departures Hoffman & Tadelis, 2021.
Fenizia uses managerial changes in Italian public offices and distinguishes improvements in office productivity from changes in workforce composition, including retirement. This is a clear reminder that manager effects can arise through allocation and personnel changes rather than faster effort by every continuing employee. Her estimated reallocation exercises also impose additional assumptions beyond the observed manager transitions Fenizia, 2022.
Keep totals, per-worker averages, and per-hour rates distinct. In an original accounting example, six workers produce 10 each and four produce 5 each: total output is 80 and output per worker is 8. If the latter four leave without replacement, the average becomes 10 while total output falls to 60. The example is not Fenizia’s result. It illustrates why a higher average can coexist with reduced capacity and why an office with fixed service obligations needs more than a productivity-ratio graph.
At minimum measure an operational outcome, an independent quality or service outcome, and a worker outcome. Lower attrition is not automatically higher welfare: outside options, switching costs, or fewer external opportunities can also reduce exits. Worker surveys, preferred schedules, hours, and safety can complement turnover records. The absence of an effect on a noisy rating is not equivalence in actual production.
5. Formal authority, real authority, and informed discretion
Aghion and Tirole distinguish formal decision rights from effective control over decisions, with information acquisition and initiative central to the analysis. Dessein studies the tradeoff between communicating to a principal and delegating to an informed agent. These models explain why a reporting line is an incomplete description of an organization Aghion & Tirole, 1997Dessein, 2002.
Original compact benchmark: local information versus conflict. A decision should match a local state . The principal’s loss is . Let headquarters’ posterior mean leave residual variance . The frontline manager’s more informative posterior mean leaves variance , but the manager prefers an action shifted by from that mean. Add expected decision costs and . With quadratic loss, posterior-error orthogonality, fixed information, and no cross-team externality:
Delegation lowers this principal-loss measure when
With , , and zero decision costs, gives delegated loss .25, versus .64 under centralization. With , delegated loss is .80. Better local information does not make unrestricted delegation uniformly beneficial. A policy that improves headquarters’ information can narrow the case for delegation; one that improves frontline information can widen it.
This is not a derivation of the full Aghion–Tirole or Dessein equilibrium. Information is fixed here; those theories allow important endogenous communication or information-acquisition choices. The benchmark also excludes worker preferences, strategic reporting, common standards, and externalities across units. It is a disciplined way to organize competing predictions, not a welfare prescription.
A practical study should measure both dimensions rather than using a broad management index: who knows the local condition, and whose objective differs? Observe forecasts versus realized demand, upward requests, overrides, budget responsibilities, and task-specific discretionary limits. Variation in authority alone may reveal a total effect, but separating information from bias requires additional measures or treatments.
Fehr–Herz–Wilkening use a controlled delegation experiment to study authority and motivation. It provides a useful laboratory counterpart to the simple benchmark: authority can carry nonpecuniary value and affect information effort. Do not infer that real managers’ observed refusal to delegate uniquely identifies a taste for power; responsibility, liability, career concerns, and organizational constraints can generate similar choices Fehr et al., 2013.
6. Changing authority without changing the manager
Bandiera–Best–Khan–Prat study an experimental reallocation of authority between procurement officers and monitors, alongside financial incentives. The design makes the holder of authority an intervention rather than a label inferred from a chart. Read prices alongside measured quality, procurement timing, and the monitor environment. The effects are evidence about this organizational arrangement, not a general rule that removing oversight is desirable Bandiera et al., 2021.
The primary comparison is not “high-performing officer versus low-performing officer.” It is a randomly assigned change in rules for a defined population. The study’s public replication repository documents the original data/code archive and its randomization-inference implementation. The synthetic lab in this pack does not recreate the paper’s assignment units, strata, or estimates Bandiera et al., 2021.
For a new experiment, specify the permission change precisely: whose approval is no longer required, which decisions remain restricted, the amount limits, whether ex post auditing changes, and whether managers are informed about the reform. A factorial design can separate authority from incentives or information, provided enough independent assignment units and compliance exist. A bundled change remains scientifically useful, but its estimand is the bundle.
For an illustrative 2×2 authority-by-information experiment with balanced allocation to all four cells within every block, a transparent saturated specification is
Here indexes assignment units, and are the assigned authority and information interventions, and is a block effect. With equal cell probabilities in every block and sample block weights, is the authority effect without information, its effect with information, and their causal interaction. Unequal cell probabilities or different target block weights require explicit standardization of block-specific cell means; pooled coefficients do not automatically deliver the intended average contrast. That interaction does not uniquely identify a psychological or organizational mechanism if either treatment changes multiple margins. Report all cell means and assignment probabilities, not only the interaction’s significance. Cluster and randomization inference must follow the actual design.
7. Hierarchies as knowledge and attention systems
Garicano’s knowledge-based hierarchy provides an organizing idea: common problems can be handled near production, while rarer problems are escalated to specialists. A hierarchy can economize on learning while incurring communication and coordination costs. This connects spans of control to a problem distribution rather than only a preferred management style Garicano, 2000.
Original queue illustration. Let workers each encounter problems per hour, and let denote the share escalated. Escalations arrive at rate . A manager resolves problems at rate . Under an explicitly illustrative M/M/1 queue with independent Poisson arrivals, exponential service, one server, first-come-first-served processing, and no abandonment,
includes waiting and service; is utilization. Set , , and . A span of 10 produces and mean time 20 minutes; a span of 30 produces and 60 minutes. At 40, no stationary distribution exists in this model. Raising frontline capability so that falls to .1 reduces the 30-worker mean to 24 minutes. These are arithmetic consequences of invented parameters, not empirical estimates of an optimal manager ratio.
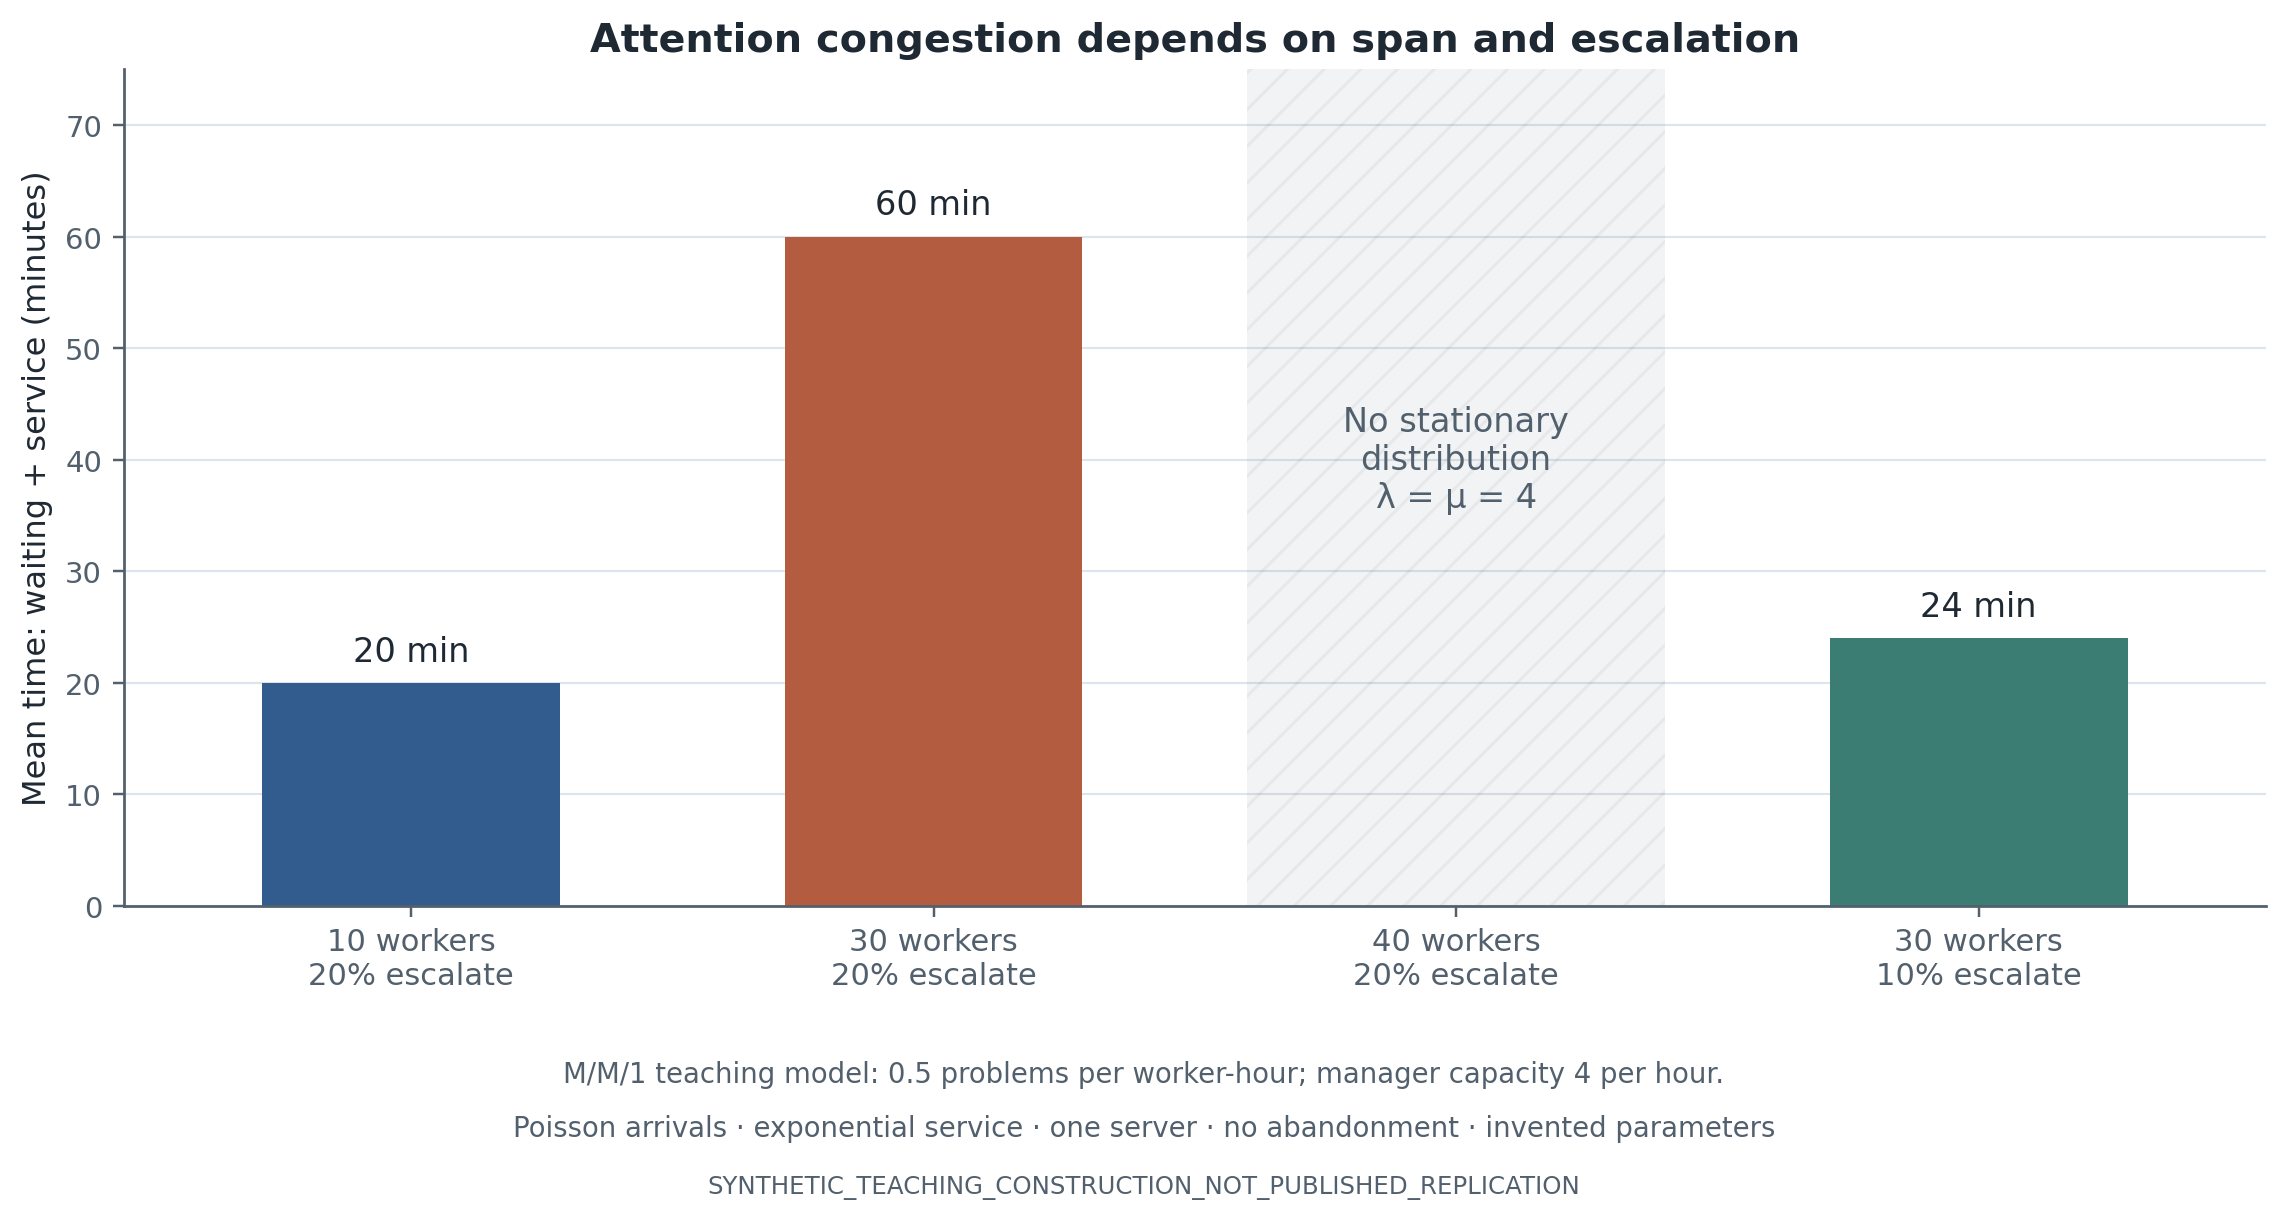
Figure 1:Original queue teaching model. Mean time includes waiting plus service; arrivals are Poisson, service exponential, and there is one server with no abandonment. The 40-worker case is nonstationary, not a zero-minute or capped delay. Parameters are invented, not estimated optimal spans. SYNTHETIC_TEACHING_CONSTRUCTION_NOT_PUBLISHED_REPLICATION. The plot script reads the lab’s generated queue CSV.
The economic contribution is the interaction: adding staff, altering local problem-solving, and improving manager processing capacity can have nonlinear effects. The limitations matter too. Real requests are prioritized, managers multitask, arrival rates respond to delays, and workers may stop asking. Recorded requests can fall precisely when the hierarchy is most congested. Collect failed or abandoned requests and multiple timestamps, not just completions.
Caliendo–Monte–Rossi-Hansberg document changes in production layers using occupational categories in French firms. The inferred layers are not literal reporting-line data. Their patterns make restructuring measurable while inviting checks on what the occupation-to-layer map captures Caliendo et al., 2015. Rajan–Wulf document flatter hierarchies and broader senior spans in a corporate panel. A flatter chart does not, by itself, establish that frontline employees have more real authority Rajan & Wulf, 2006.
Hjort–Malmberg–Schoellman, published in 2026, link cross-country middle-management costs to the adoption of management-intensive organizational structures using compensation data and a calibrated model. It broadens the lecture beyond the assumption that managerial capacity is equally affordable everywhere. Keep the measured cost patterns separate from the model-based counterfactuals Hjort et al., 2026.
8. Information technology and managerial time use
Bloom and coauthors distinguish information technology from communication technology in their analysis of firm organization. Better access to information at the frontline and cheaper communication up a hierarchy need not generate the same organizational response. Their empirical comparisons and identification arguments are not a randomized treatment of “technology” in general Bloom et al., 2014.
This distinction is a useful starting point for AI-related questions without making the week another technology survey. An assistant that helps a worker resolve an unusual problem can reduce escalation. A tool that summarizes requests for headquarters can make central oversight cheaper. A tool that generates more reports can increase the managerial queue. These are proposed mechanisms, not findings established for all AI deployments.
Bandiera, Hansen, Prat, and Sadun collect CEO activity information and relate behavioral patterns to firm performance. Time-use data make otherwise hidden coordination visible, while their modeling highlights matching between CEO behavior and firm needs. Minutes in meetings are not automatically lost production or proof of coordination quality. Use the corrected author order: the 2020 erratum corrects authorship ordering, not an estimated result Bandiera et al., 2020Erratum, 2020.
The working paper by Dessein and coauthors on knowledge work emphasizes ex ante coordination versus execution in project work. It is useful for designing a task-phase ledger: the same meeting time may be productive at project launch and redundant during routine execution. Its version is a 2024 RIETI discussion paper; do not label it a published 2026 article Dessein et al., 2024.
For actual data collection, combine diaries or calendar categories with sampled decision audits. Automated meeting counts miss preparation, unrecorded conversations, and delegated attendance. Distinguish who attended from who decided. High centrality in a communication graph can mean effective coordination, unresolved bottlenecks, or an administrative role. The causal network designs needed to separate those interpretations belong in the network methods course.
9. Adaptation, matching, and persistence
Adhvaryu, Kala, and Nyshadham combine productivity shocks and worker-task allocation in a manufacturing environment. The design is useful for studying how managers respond to a changing production constraint. Exposure variation and measured managerial attention play different empirical roles; measured attention is not itself randomly assigned Adhvaryu et al., 2022. Their related work with Tamayo studies managerial quality and productivity dynamics through a model of matching and learning. Model-implied mechanisms should be distinguished from reduced-form evidence Adhvaryu et al., 2023.
The retail study by Metcalfe, Sollaci, and Syverson uses personnel movements in chains with common practices to study manager contributions and matching. It is a valuable warning that organizational assignment can make raw performance misleading. Use the verified NBER working-paper version rather than asserting publication status not established here Metcalfe et al., 2023. Bertrand and Schoar’s manager-style analysis is a complementary executive-panel example: persistent differences following manager movements can organize important evidence without making appointments random Bertrand & Schoar, 2003.
These examples suggest a disciplined decomposition of outcomes after a managerial change. Ask whether changes occur immediately, build gradually, persist after departure, concentrate in task reassignments, or accompany workforce replacement. Write a counterprediction before looking at the data. Immediate changes in scoring with unchanged independent output support a different explanation from gradual gains on comparable tasks. No single timing pattern is dispositive; the contribution is the combination of variation, measurement, and exclusions.
10. Research opportunities and data to request
A promising project starts with an organizational decision, not access to a large HR file. The following are proposed research directions, not claims that the literature is empty.
Authority under new information tools. Compare frontline assistance with headquarters triage using the same underlying knowledge base. Observe escalation, decision quality, delays, overrides, and worker autonomy. A change in total output is informative, but recipient-specific randomization can more directly separate local problem-solving from centralized monitoring.
Portable manager skill versus match quality. Repeatedly assign managers to comparable teams and later test performance on new task types. Estimate ranking stability on independent data. A claim about portable skill requires more than reproducing rankings on the same team; complementarity itself can be the economically interesting result.
Spans, attention, and abandoned decisions. Study a plausibly exogenous change in reporting load or a randomized triage process. Measure attempts, queue entry, escalation, resolution, and abandonment. Do not infer a congestion mechanism from lower observed request counts alone. Evaluate manager hours and subordinate workload as well as throughput.
Manager contributions to worker welfare. Pair worker–manager spells with confidential worker-reported conditions and objective schedules or absence. Fix the survey timing and protect respondents from identifiable disclosure. Ask whether apparently productive practices trade off output, safety, and unwanted hours. This is an organizational research question, not a diagnosis of individuals.
Authority with institutional constraints. Compare rule changes in organizations where discretion is task-specific and externally constrained. The generalized mechanism can be information versus approval delay; the policy conclusion should remain scoped to the institution and the measured outcomes. Do not present administrative performance as a complete social-welfare objective.
Practical source families are listed below. The WMS offers questionnaire resources and information about management surveys; its public download route reported maintenance at the pack’s research date (2026-09-21). That dated statement is not a guarantee of current download access. Census MOPS documentation helps define management-practice variables but is not a ready-made worker–manager linked panel. Requesting restricted microdata is not part of this package World Management Survey, n.d.U.S. Census Bureau, n.d..
Table 3:Data and measurement
| Source / data family | What researchers can measure | Access and practical rule | What it does not automatically establish |
|---|---|---|---|
| HR reporting and assignment histories | Worker–manager spells, rotations, acting appointments, spans | Request effective dates and historical records, not only a current org chart; usually firm-restricted | Exogenous assignment, real authority, or comparable tasks |
| Decision and approval logs | Proposals, escalation, vetoes, approvals, and waiting | Retain denied and withdrawn requests; reconcile units and software revisions | Unrecorded deliberations or all opportunity costs |
| Operations + payroll + quality | Output, hours, staffing, pay, returns, service outcomes | Join at declared keys; preserve baseline and current-population denominators | Welfare or effort from one score |
| WMS questionnaires World Management Survey, n.d. | Management-practice and authority question design | Public questionnaire resources; download route reported maintenance during pack research (2026-09-21). Verify current access, not a guaranteed data fetch. | Worker–manager longitudinal assignment or experimental practices |
| Census MOPS documentation U.S. Census Bureau, n.d. | Establishment practices and organizational responses | Public documentation/tabulations distinct from confidential microdata; no access application needed for this lab | Individual manager skill or a ready-made matched worker panel |
| Weidmann et al. archive Weidmann et al., 2026 | Article-associated experiment data and code, subject to actual archive contents | Published article links DOI 10.7910/DVN/ZZWBEQ. Archive file contents/license not inspected or executed here. | Permission to reuse all data or a successful original replication |
| Bandiera et al. repository Bandiera et al., 2021 | Original authority-experiment replication route | Author README lists data/code DOI 10.7910/DVN/OJQWO2 and Stata master; original files not run here | Same assignment design as the synthetic teaching lab |
| Minni code pointer Minni, 2026 | Implementation of manager-rotation study | Article specifies code at 10.7910/DVN/HU6OQO. Do not label confidential firm data public. | A runnable firm-microdata exercise without permissions |
| Diaries / calendars / messages | Manager activities, recipients, meeting and project phases | Use consented/minimized research extracts and task categories; protect subordinate identities | Meeting counts as a causal measure of coordination quality |
| Independent skill / worker surveys | Baseline skills, autonomy, experience, strain | Fix survey timing and protect confidential responses; record nonresponse | Objective skill from a supervisor rating or clinical diagnosis |
| Supplied offline teaching data | Assignment comparison, rank support, score reliability, authority and queue arithmetic | Generated from the included standard-library script; no external dependency | Any empirical fact about the original papers or real workplaces |
Research Lab
Reproduce
The primary design anchor is Weidmann et al. (2026): separating a manager contribution from the team’s preexisting skill through randomized assignments. The guaranteed lab uses an original synthetic matched-pair reassignment exercise, not the paper’s task, experimental allocation, participants, or estimates. Its numerical outputs must be labeled accordingly. The optional original replication route is separate and requires inspecting the published data/code release and its license Weidmann et al., 2026Weidmann et al., 2026.
In the offline exercise, 24 invented teams form 12 pairs. All receive replacement managers at the same date; one team per pair is randomly assigned an incoming manager with a higher independently fixed score. A stable synthetic worker roster makes it possible to see the assignment comparison without compositional change in the main module. Students compute pair-level pre/post changes, event-time contrasts, and the exact distribution of a paired statistic over 4,096 permitted assignments under the sharp null of no assignment effect. Baseline team quality and simulated potential outcomes are generated before assignment.
For pair , let and be team mean output across six post-periods minus mean output across three pre-periods for the high- and low-assigned teams. Equal weighting of the twelve pairs gives
The descriptive pair-level SE is the sample standard deviation of these twelve contrasts divided by . It is not an exact small-sample confidence interval. The exact test conditions on the paired assignment and tests zero effect for every team, with no cross-team interference; it does not test every heterogeneous zero-average-effect null. Averaging potential-outcome estimates across assignments is a separate instructor truth check, not this sharp-null reference distribution.
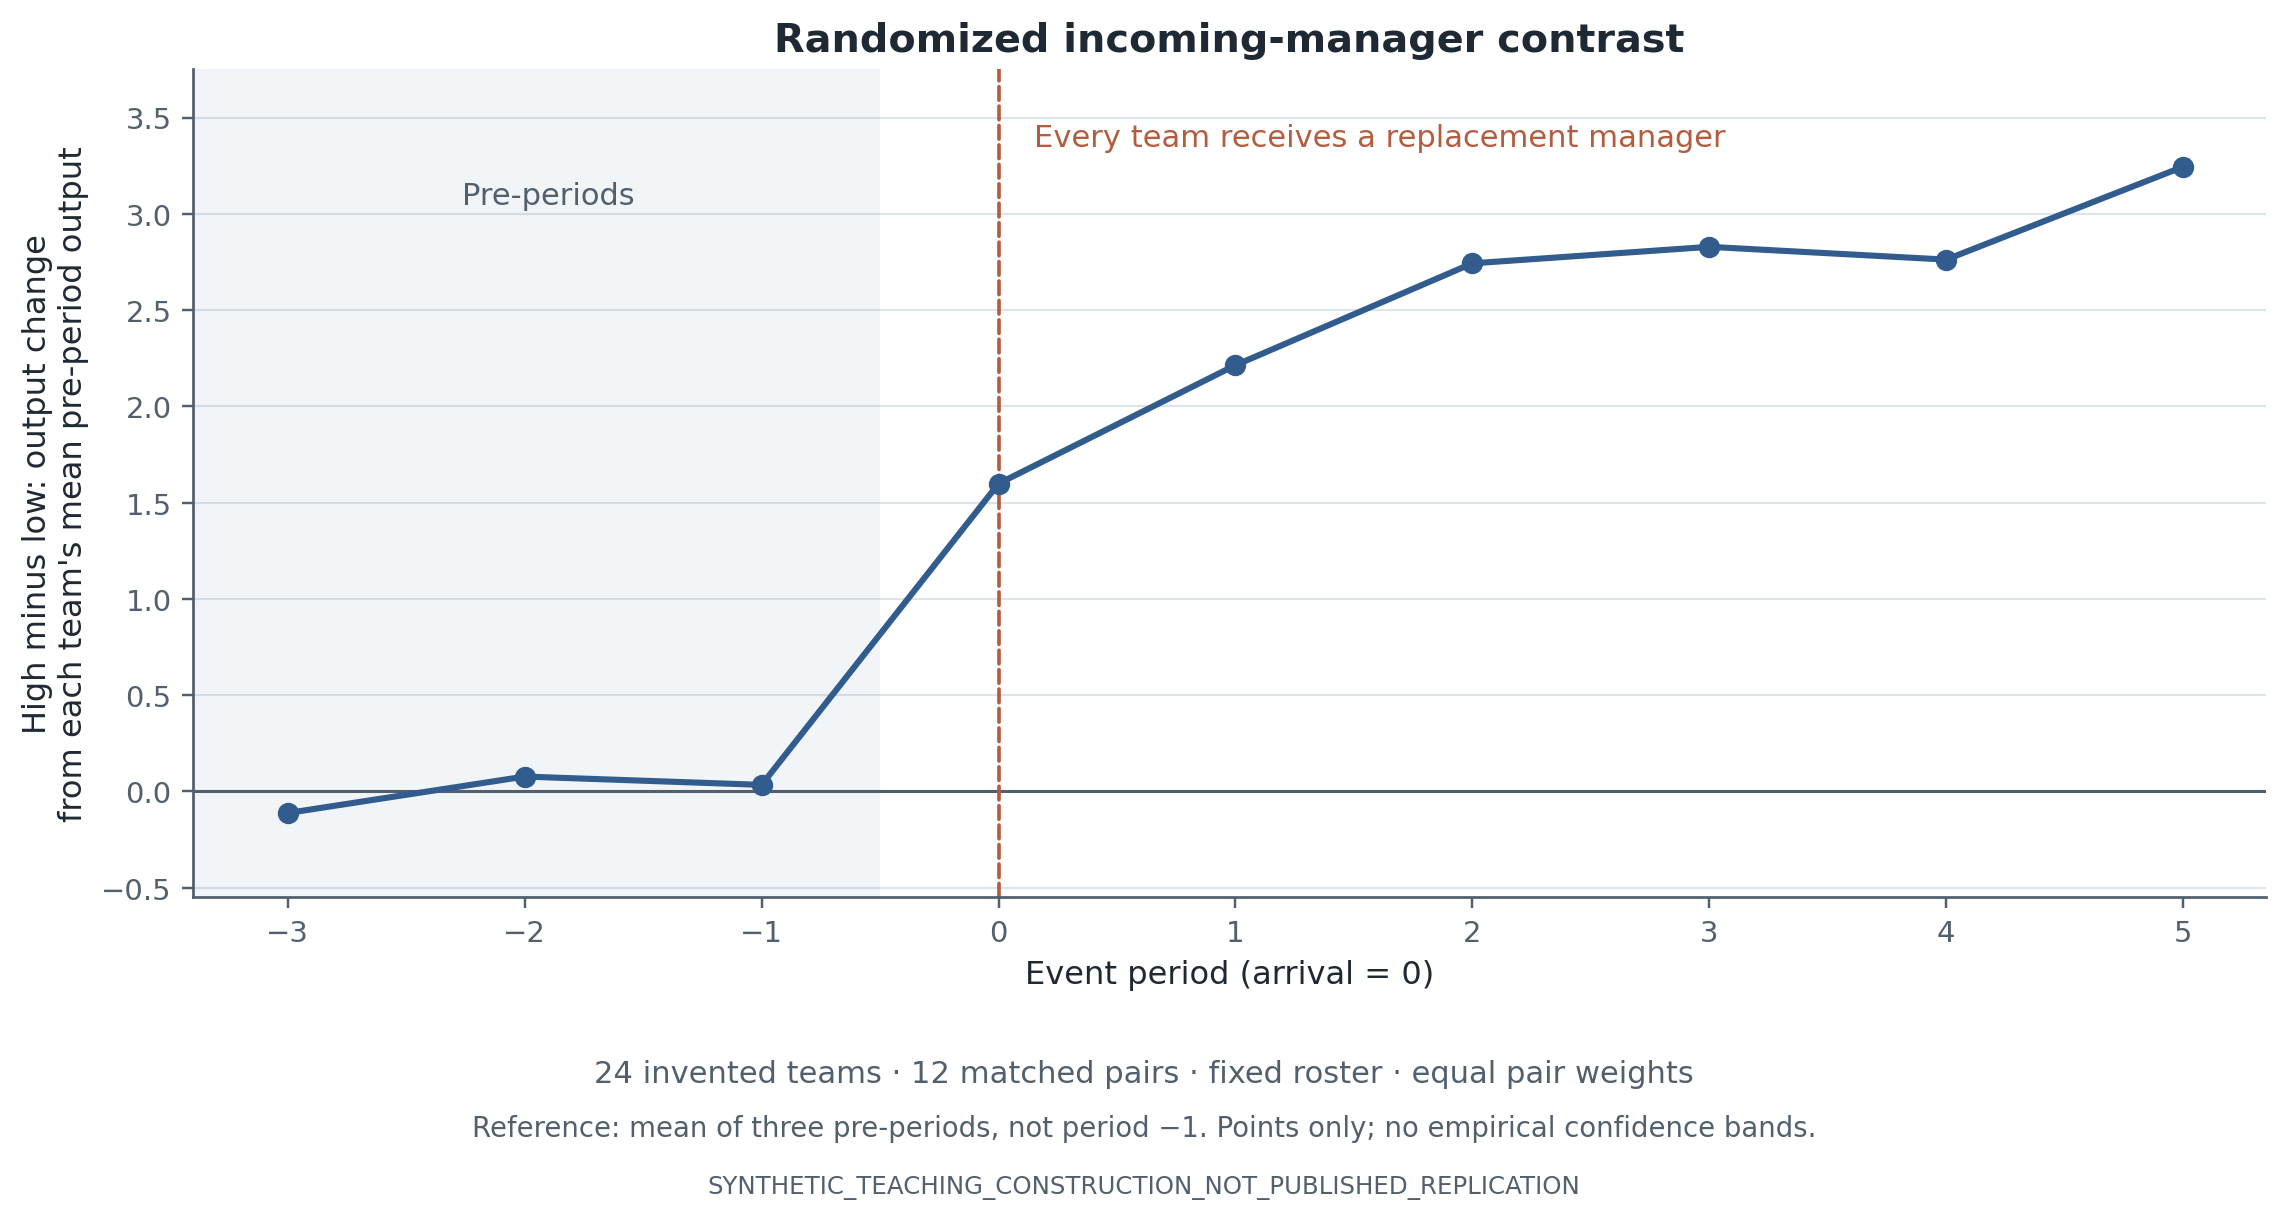
Figure 2:Synthetic matched-pair assignment. Twenty-four invented teams, twelve independently randomized pairs, and a fixed worker roster. Points are equal-pair-weighted high-minus-low contrasts after subtracting each team’s mean across three pre-periods, rather than the single reference in the earlier diagnostic equation. There are no empirical confidence bands. SYNTHETIC_TEACHING_CONSTRUCTION_NOT_PUBLISHED_REPLICATION. The plot script preserves the exact generated event-time CSV.
Diagnose
The main exercises deliberately expose different failures. A rescue-appointment example has zero manager treatment effect but a positive before/after rebound. A connectivity example shows why managers permanently tied to sites cannot be separately ranked after site effects. A noisy-score example separates observed variance from reliable variation. A composition example distinguishes average productivity from total output. Delegation and queue modules reproduce the original arithmetic above, not empirical findings.
Students must state which exercise concerns identification, which concerns measurement, and which concerns inference. They must also distinguish the assigned incoming-score contrast from the causal return to training managerial skill. The synthetic assignment randomizes access to a manager type; it does not randomize the production of the type.
Transfer
Write a two-page proposal for one field setting. Define the managerial transition or authority reform, appointment chronology, comparison group, decision-rights ledger, independent quality outcome, worker-welfare measure, inference unit, and the largest remaining matching threat. Include one comparison that would distinguish two mechanisms. The authority experiment in Bandiera et al. and the rotation designs in Minni and Fenizia offer different transfer routes; they should not be blended into a fictional common design Bandiera et al., 2021Minni, 2026Fenizia, 2022.
Methods Box
A. Connectedness is identification support, not an exogeneity test
With additive worker and manager effects, variation linking workers to multiple managers permits comparisons within connected components after normalization. Disconnected components do not share an empirically identified manager-level origin. Report component sizes, mover counts, tenure support, and whether conclusions depend on a few bridging observations. If each manager belongs permanently to one site, manager and site effects cannot be disentangled merely by adding both sets of dummies Abowd et al., 1999.
A connected graph still permits endogenous assignment: a manager may arrive because the unobserved team trajectory changed. Graph support and a credible assignment story are complementary requirements, not substitutes. Match effects and time-varying manager performance require further variation and structure beyond an additive model.
B. Do not rank managers on the outcomes you then “explain”
A manager score computed from the focal worker’s future output can mechanically predict that output. Fix score-construction periods and focal exclusions before analysis. Cross-fit at the relevant dependence unit; a row-level random split can leak the same worker, team, or event across folds. An independently observed characteristic such as past promotion speed avoids one mechanical problem but raises its own substantive interpretation and selection questions.
Noisy fixed effects can exaggerate dispersion. In a stripped-down illustration, independent score estimates obey and . Under mean-zero independent errors orthogonal to , the variance of one score includes noise, while cross-half covariance targets . These assumptions fail with shared shocks or persistent measurement errors. This illustration is not the Kline–Saggio–Sølvsten leave-out estimator; their work addresses quadratic forms in a regression system with its own support and inferential requirements Kline et al., 2020.
C. State the treatment path and the comparison
For rotations, separate managerial entry from worker entry, temporary coverage from permanent replacement, and first exposure from repeat exposure. For a stacked event design, freeze risk-set construction, overlapping event rules, comparison histories, and weights. For a simple before/after study, explicitly list shocks that could explain the change without the manager. Retain a credible null result rather than selecting windows after pretrend tests Roth, 2022.
For an experiment, archive the actual eligible assignment set. A valid permutation test reassigns treatment as randomized, not by shuffling manager IDs across offices that could never have shared a manager. State the sharp null being tested; its rejection need not identify homogeneous manager effects or justify a particular mechanism. In a factorial experiment, inspect joint treatment probabilities and all cell counts before estimating interactions.
D. Treat composition and resources as mechanisms or confounders deliberately
Use a stable baseline cohort for some outcomes and an all-current-worker sample for others, reporting both populations. Exits, new hires, and transfers can be effects of managers; dropping them changes the estimand. A total organizational effect may properly include task reallocation. A direct within-task effect requires additional assumptions, not merely controlling for realized tasks.
Build an accounting panel of output, hours, headcount, task mix, quality, and resources. Do not combine output from a continuing unit with a denominator from a selected employee sample. Document changes in task definitions, reporting software, and site boundaries. A manager’s residual contribution may otherwise absorb changes in the recording system.
E. Align uncertainty with assignments and dependence
Teams sharing a manager or site can share shocks; workers observed repeatedly are not independent. The correct clustering and resampling strategy depends on assignment, sampling, and dependence rather than on the number of rows. Few managers or few independent sites cannot be made into a large experiment by observing more shifts. Multiway clustering is not a universal remedy for few support units or a misspecified design Cameron & Miller, 2015.
For policy counterfactuals based on estimated manager rankings, uncertainty in scores and assignment gains should be propagated. Reestimate the relevant stages when feasible; report when rankings or parameters are held fixed. Bootstrap and leave-out methods answer different questions and require compatible designs. A model that sorts managers into new teams also assumes something about match portability, resources, and equilibrium responses.
F. Validate the mechanism and the decision-rights intervention
Create at least one independent measure of quality and one measure of the proposed channel. A delegation intervention should verify who actually made decisions, not only whether the policy memo was sent. A teaching claim needs task or skill measures beyond supervisor ratings. A retention claim should distinguish voluntary exits, transfers, termination, and retirement where records permit. A hierarchy claim should not infer real authority solely from occupational layers.
Use a fixed outcome dictionary and report implementation failure as an outcome. Pre-specify primary outcomes and distinguish exploratory mechanism evidence from a randomized component. The methods below provide concrete choices without pretending that every mechanism is separately identified in every paper.
Table 4:Methods and identification checklist
| Problem | Implementable response | What it buys | What remains / anchor |
|---|---|---|---|
| Manager or worker changes? | Construct dated worker–manager spells; label manager arrival, worker arrival, and acting coverage separately | Meaningful treatment chronology and risk sets | HR date quality and anticipation must be checked. |
| Person versus match effects | Repeated assignments with independent baseline skills; test on new teams | Evidence on portable contribution versus complementarity | Need support and assignment assumptions Weidmann et al., 2026. |
| Permanent manager–site confounding | Build connectedness graph and inspect model rank before fitting | Identifies which additive comparisons are supported | Connectedness does not establish exogenous moves Abowd et al., 1999. |
| Endogenous rescue appointments | Compare transition types, inspect pre-appointment shocks, use institutional assignment rules | Removes some generic switch effects and reveals mean reversion | No automatic fix from worker fixed effects or flat pretrends Minni, 2026Roth, 2022. |
| Future-outcome manager rankings | Freeze pre-period score or cross-fit excluding focal workers/teams/events | Removes specific mechanical leakage | The independent score may still reflect prior opportunities or selection. |
| Noisy estimated-effect variance | Use an appropriate quadratic-form/leave-out method with checked support | Addresses estimation noise in variance components | Not equivalent to simple leave-self-out averages Kline et al., 2020. |
| Task and worker composition | Report baseline-cohort and current-population outcomes, totals and rates | Makes allocation and selective exits visible | Post-treatment task controls change the target Fenizia, 2022. |
| Authority reform mixed with pay or information | Precisely code permission changes; use factorial randomization when feasible | Identifies effects of assigned components and interactions | Interpretation still depends on what each component changes Bandiera et al., 2021. |
| Few independent treatment units | Use assignment-aware tests; report cluster counts, dependence, finite-sample limits | Inference aligned with the experiment or sampling design | More worker-periods do not create more assignments Cameron & Miller, 2015. |
| Persistent gains after a manager leaves | Measure tasks, skills, staffing and resources before/after departure | Discriminates among several durable channels | Persistence alone is not proof of teaching Lazear et al., 2015Minni, 2026. |
| Flattening called decentralization | Observe proposed/approved/overridden decisions alongside chart depth | Separates formal chart from exercised rights | Some informal authority remains unobserved Aghion & Tirole, 1997Rajan & Wulf, 2006. |
| Attention mechanism | Track attempted requests, queue entry, resolution and abandonment | Distinguishes capacity from discouraged demand | Stylized queue assumptions need validation, not just fit Garicano, 2000. |
Reading Ladder And References
Three required papers: Lazear–Shaw–Stanton (2015), Bandiera–Best–Khan–Prat (2021), and Weidmann et al. (2026). For each, students submit setting, decision, variation, estimand, outcome, and one remaining threat. The point is to compare designs, not memorize three effect sizes.
Theory and field orientation: Benson–Shaw; Aghion–Tirole; Dessein; Garicano. Use selected sections that illuminate the empirical question, not full proofs of every model.
Rotating presentations: Hoffman–Tadelis and Fenizia for outcome interpretation; Minni and Adhvaryu and coauthors for allocation and persistence; Caliendo and coauthors, Rajan–Wulf, and Hjort and coauthors for hierarchies and constraints; Bloom and coauthors for information and delegation; Bandiera and coauthors for managerial time use; Fehr and coauthors for experimental authority. Dessein et al. and Metcalfe et al. are clearly labeled working-paper resources.
Methods follow-up: Abowd–Kramarz–Margolis, Kline–Saggio–Sølvsten, Roth, Cameron–Miller. These readings support specific methodological decisions, not a replacement econometrics course.
Table 5:Paper designs and evidence
| Paper | Setting and variation | What to learn from the design | Main limitation / boundary |
|---|---|---|---|
| Lazear–Shaw–Stanton Lazear et al., 2015 | Personnel output linked to supervisors | Specify manager comparisons, worker heterogeneity, and persistence | Assignment and portability need arguments; not a general RCT. |
| Weidmann et al. Weidmann et al., 2026 | Repeated randomized manager–team assignment, plus distinct validation exercises | Separate individual skill, managerial contribution, selection into management, and predictive validation | Lab assignment does not randomize a trait or make all field validation causal. |
| Bandiera–Best–Khan–Prat Bandiera et al., 2021 | Field experiment in authority and financial incentives | Change decision rights while distinguishing assigned rule from worker identity | Interpretation depends on actual authority, measured quality, and institutional constraints. |
| Hoffman–Tadelis Hoffman & Tadelis, 2021 | Survey-linked personnel records; new-hire and switcher evidence | Distinguish attrition from other outcomes and examine rating timing | Worker ratings and assignments can be endogenous. |
| Fenizia Fenizia, 2022 | Manager changes in public offices | Track office productivity alongside retirement and composition | Within-incumbent effort is not identical to office-level productivity. |
| Minni Minni, 2026 | Manager rotations, prior promotion speed, worker records | Compare transition types and persistent allocation-related outcomes | Rotation institution and score proxy need scrutiny; careers developed in Week 6. |
| Adhvaryu–Kala–Nyshadham Adhvaryu et al., 2022 | Productivity shocks and managerial response in production | Connect external constraints to task allocation | Variation in shocks and measured managerial attention are not the same experiment. |
| Adhvaryu–Nyshadham–Tamayo Adhvaryu et al., 2023 | Production dynamics and modeled matching/learning | Link moments, survey traits, and structural channels | Model implications are not assumption-free treatment effects. |
| Metcalfe–Sollaci–Syverson Metcalfe et al., 2023 | Retail manager movements under common chain practices | Understand manager contributions when assignments are selective | Working paper; common practices do not eliminate matching. |
| Fehr–Herz–Wilkening Fehr et al., 2013 | Laboratory delegation game | Distinguish pecuniary incentives, information effort, and authority motives | Lab authority preference is not a sufficient explanation of all field centralization. |
| Caliendo–Monte–Rossi-Hansberg Caliendo et al., 2015 | Occupation-based layers in French firms | Make hierarchy construction explicit | Layer changes are not randomized organizational redesign; occupations are proxies for layers. |
| Rajan–Wulf Rajan & Wulf, 2006 | Corporate hierarchy panel | Separate depth, span, and executive reporting | Chart flattening does not directly establish frontline discretion. |
| Bloom–Sadun–Van Reenen Bloom et al., 2012 | Cross-country survey of authority over different tasks | Measure delegation at the decision level | Cross-country institutions and trust are not randomized. |
| Bloom et al. Bloom et al., 2014 | Information and communication technologies and organization | Opposing theoretical channels can hide within a broad technology variable | Empirical identification is not a generic technology RCT. |
| Bandiera–Hansen–Prat–Sadun Bandiera et al., 2020 | CEO activity data and behavior–firm matching | Turn time use into an economically interpreted object | Meeting patterns do not identify the benefit of changing schedules by themselves. |
| Bertrand–Schoar Bertrand & Schoar, 2003 | Executives moving across firms | Study persistence in firm policies associated with managers | Manager movement alone is not randomization. |
| Hjort–Malmberg–Schoellman Hjort et al., 2026 | International manager pay and calibrated organization model | Distinguish measured managerial costs from model-based adoption counterfactuals | Not a randomized subsidy to managers; published metadata checked via NBER. |
| Dessein et al. Dessein et al., 2024 | Project organization and knowledge work | Separate coordination before execution from subsequent production | Working paper; time-use associations require a selection story. |
Table 6:Reading and lab map
| Layer | Reading / activity | Student task |
|---|---|---|
| Required 1 | Lazear–Shaw–Stanton Lazear et al., 2015 | Explain a manager-effect comparison, supported population, and residual assignment threat. |
| Required 2 | Bandiera–Best–Khan–Prat Bandiera et al., 2021 | Draw decision rights before/after intervention and separate assigned components from measured mechanisms. |
| Required 3 | Weidmann et al. Weidmann et al., 2026 | Separate random manager assignment, selection into roles, trait prediction, and field validation. |
| Selected theory | Benson–Shaw; Aghion–Tirole; Dessein; Garicano | Connect one formal mechanism to a data request; proofs are optional. |
| Outcomes and allocation presentations | Hoffman–Tadelis; Fenizia; Minni; Adhvaryu and coauthors | Distinguish performance, attrition, composition, learning, and matching. |
| Hierarchy and information presentations | Caliendo et al.; Rajan–Wulf; Bloom and coauthors; Hjort et al. | Explain what is observed versus modeled in authority and hierarchy claims. |
| Time use and authority presentations | Bandiera et al.; Fehr et al.; Dessein et al.; Bertrand–Schoar | Separate causal intervention from style/time-use association. |
| Methods follow-up | AKM; Kline–Saggio–Sølvsten; Roth; Cameron–Miller | State one implementation requirement and one limitation for a selected correction. |
| Reproduce | Synthetic matched-pair manager reassignment | Reconstruct pair effects and the actual sharp-null assignment distribution. |
| Diagnose | Rescue appointments; graph rank; score variance; composition | Name whether each failure is identification, measurement, inference, or interpretation. |
| Transfer | Two-page field manager/authority proposal | Specify transition, comparison, remaining matching threat, quality and welfare measures. |
Exercises And Discussion Prompts
A firm replaces a low-scoring manager after three weak months. Output subsequently recovers. Specify two nonmanager explanations and a defensible comparison.
Derive the centralization/delegation loss comparison. Identify which assumption would fail if delegation changed information acquisition.
Use the two-team assignment table to distinguish a portable managerial ranking from match-specific advantage. What variation would recover each?
A restructuring halves hierarchy depth and doubles top-level spans. What additional records are needed before calling the reform decentralization?
A manager’s arrival increases average output per worker and retirements. Design the totals, cohort, and quality tables necessary for interpretation.
An AI tool reduces escalations. Describe one explanation involving better frontline information and one involving discouraged requests. What data separate them?
A manager-quality variable is built from all future workers’ outcomes. Redesign the score construction and explain which assignment threats remain after cross-fitting.
Complete the transfer proposal. End with the exact claim the proposed data and comparison would justify, and one claim they would not.
Reproducibility And Code Lab Note
Download the teaching repository (ZIP), or clone the repository. Keep its folder structure and open books/special-topic8-organizational/labs/05-managers-hierarchies-authority-and-delegation/; the lab README supplies the run instructions. Weeks 1–3 use the shared plotting module supplied with the repository.
The Week 5 lab handout and lab README implement synthetic design reconstruction and original teaching calculations. The assigned teams, manager scores, potential outcomes, parameters, and effect sizes are invented; empirical_replication is false. No original microdata were downloaded or executed. Published archive availability is recorded separately from file/license inspection and replication status. The optional original-data route is omitted pending those checks.
From the course root, run the lab and then regenerate both figures:
ENV_NAME=research bash labs/05-managers-hierarchies-authority-and-delegation/smoke.sh
conda run -n research python assets/scripts/build-week5-management.py
The standard-library lab checks the actual paired assignment, timing, fixed roster, potential-outcome consistency, all 4,096 sharp-null allocations, and the separate truth enumeration. It also checks mean reversion, rank support, noisy scores, delegation, queue stability, composition, and comparative advantage. Two fresh default-seed runs must have identical manifests; an additional seed runs the same checks; a nonempty output directory must be refused without erasing files. Instructor truth stays outside learner predictor files. Figure generation uses the installed Matplotlib environment and preserves exact input CSVs. No network, credentials, proprietary data, GPU, or API is required.
The transfer memo template requires a two-page proposal with a defined transition or reform, comparison, residual matching threat, independent quality outcome, and worker-welfare measure. The synthetic demonstration is a research-design template, not validated production software for arbitrary personnel data.
Slide Companion Note
The Week 5 slide deck (PDF) and Beamer source move from the three ledgers to manager contributions, assignment threats, experimental contrasts, delegation, knowledge hierarchies, attention, frontier applications, and the research proposal. The full lecture keeps the Weidmann laboratory, prediction, selection, and field-validation evidence distinct. Original numerical models remain visibly separate from empirical findings; long evidence maps stay in the chapter.
Compile from the course root:
conda run -n research latexmk -cd -pdf -interaction=nonstopmode slides/week5/05-managers-hierarchies-authority-and-delegation.texThe deck follows the completed course’s Beamer style and uses the two generated teaching figures. Assumptions accompany equations and empirical limitations accompany results.
Bridge Forward
Week 5 explains how managers and authority systems shape work and opportunities. Week 6 turns to the resulting career machinery: training, internal mobility, promotions, and ladders. Carry forward one question: when a worker advances, did the organization build skill, learn about skill, allocate skill better, or change access to opportunities?
- Benson, A., & Shaw, K. (2025). What Do Managers Do? An Economist’s Perspective. Annual Review of Economics, 17, 635–664. 10.1146/annurev-economics-082222-073303
- Bloom, N., Sadun, R., & Van Reenen, J. (2012). The Organization of Firms Across Countries. The Quarterly Journal of Economics, 127(4), 1663–1705. 10.1093/qje/qje029
- Abowd, J. M., Kramarz, F., & Margolis, D. N. (1999). High Wage Workers and High Wage Firms. Econometrica, 67(2), 251–333. 10.1111/1468-0262.00020
- Lazear, E. P., Shaw, K. L., & Stanton, C. T. (2015). The Value of Bosses. Journal of Labor Economics, 33(4), 823–861. 10.1086/681097
- Roth, J. (2022). Pretest with Caution: Event-Study Estimates after Testing for Parallel Trends. American Economic Review: Insights, 4(3), 305–322. 10.1257/aeri.20210236
- Minni, V. (2026). Making the Invisible Hand Visible: Managers and the Allocation of Workers to Jobs. The Quarterly Journal of Economics, 141(3), 1871–1920. 10.1093/qje/qjag017
- Weidmann, B., Vecci, J., Said, F., Bhalotra, S., Adhvaryu, A., Nyshadham, A., Tamayo, J., & Deming, D. (2026). How Do You Identify a Good Manager? The Quarterly Journal of Economics, 141(2), 1581–1633. 10.1093/qje/qjag004
- Hoffman, M., & Tadelis, S. (2021). People Management Skills, Employee Attrition, and Manager Rewards: An Empirical Analysis. Journal of Political Economy, 129(1), 243–285. 10.1086/711409
- Fenizia, A. (2022). Managers and Productivity in the Public Sector. Econometrica, 90(3), 1063–1084. 10.3982/ECTA19244
- Aghion, P., & Tirole, J. (1997). Formal and Real Authority in Organizations. Journal of Political Economy, 105(1), 1–29. 10.1086/262063
- Dessein, W. (2002). Authority and Communication in Organizations. The Review of Economic Studies, 69(4), 811–838. 10.1111/1467-937X.00227
- Fehr, E., Herz, H., & Wilkening, T. (2013). The Lure of Authority: Motivation and Incentive Effects of Power. American Economic Review, 103(4), 1325–1359. 10.1257/aer.103.4.1325
- Bandiera, O., Best, M. C., Khan, A. Q., & Prat, A. (2021). The Allocation of Authority in Organizations: A Field Experiment with Bureaucrats. The Quarterly Journal of Economics, 136(4), 2195–2242. 10.1093/qje/qjab029
- Bandiera, O., Best, M. C., Khan, A. Q., & Prat, A. (2021). Replication Repository for The Allocation of Authority in Organizations. 10.7910/DVN/OJQWO2
- Garicano, L. (2000). Hierarchies and the Organization of Knowledge in Production. Journal of Political Economy, 108(5), 874–904. 10.1086/317671