Week 9. Organizational Change and Work Design
Learning Objectives
By the end of this week, students should be able to:
distinguish assigning a reform, implementing its components, using a tool, and maintaining an organizational practice;
explain complementarity, implementation incentives, production bottlenecks, transition costs, and organizational persistence using compact models;
identify what a bundled intervention establishes and what additional variation would identify a component or interaction;
compare consulting, technology, AI, hybrid-work, and scheduling interventions without treating different treatments and populations as interchangeable;
build an outcome system covering verified production, independent quality, time, worker conditions, composition, and costs;
propose a reform evaluation with explicit horizons, spillover exposure, attrition handling, and assignment-aware inference.
Opening Orientation
Central question: Why do similar changes in practices, technology, and work arrangements perform differently across organizations?
A company can purchase the same software as its competitors, adopt the same management checklist, or announce the same hybrid schedule and obtain a different result. That observation is the beginning of a research question, not evidence that organizations are inexplicably different. The relevant differences may be observable: how work is divided, who approves decisions, which tasks limit throughput, who pays the transition costs, what workers know, and whether the new routines survive the initial implementation effort.
This week studies a change in the work system, not a technology in isolation. It connects the earlier weeks without repeating them. A new practice can change screening, measurement, incentives, authority, career opportunities, coordination, and job value simultaneously. The empirical task is to identify which change was assigned, what workers and managers actually experienced, and what conclusion the comparison supports.
The point is not to produce a list of good management practices. It is to learn how to evaluate a reform when the treatment has components, implementation takes time, and the same recorded productivity improvement could arise from faster work, better allocation, selective exit, or changed recording. The field overview in Hoffman and Stanton is useful background; the empirical core below compares deliberately different designs Hoffman & Stanton, 2025.
Core Points
Bridge
Imagine that a drafting tool doubles the number of documents a worker can prepare, but the same reviewer must still approve every document. Finished output may barely change. A second organization changes both drafting and review, while a third records more drafts without verifying their quality. To compare the reforms, follow assignment → implementation → sustained routine → verified outcome → incidence. Ask what each worker and manager must do differently, and who gains or bears the cost.
Week 3 separated production from its measurement. Week 4 examined rewards; Week 5 authority; Week 6 development and allocation; Week 7 lateral coordination; and Week 8 job value, outside options, and voice. Week 9 studies reforms that move several of those margins together. The unit of intervention might be an employee’s access to a tool, a team’s workflow, a plant’s management practices, or an organization’s scheduling system. Those are different counterfactuals.
The boundary with the technology special topic is equally important. Here AI and digital tools enter as organizational interventions: what changes in tasks, information, approvals, quality control, and implementation? Aggregate automation, national employment effects, and the entire technology-adoption literature are not retaught. Week 10 will handle the course-wide proposal defense and broader portability of one-firm research.
Field Core
1. Build a reform ledger before an outcome regression
Begin with an initial eligible population and a dated intervention contract. Record announcement, assignment, eligibility, activation, first substantive use, support, changes in compensation or authority, updates, suspensions, and the end of external assistance. Also record the control regime. A control group that later receives the reform is no longer a permanently untreated population.
Use four linked records. The component record says what changed and for whom. The implementation record measures delivery, availability, use, exceptions, and maintenance. The production record follows tasks, inputs, output, quality, queues, and resources. The worker record follows hours, pay, burdens, discretion, exits, and survey observation. Keep identifiers and time windows consistent without assuming that all confidential files can legally be linked.
For unit at date , let be assignment to an offer, actual access, use, and a complementary redesign. These variables need not coincide. Comparing users with nonusers usually conditions on a choice made after assignment. A reform that changes access, training, and managerial expectations can affect outcomes without recorded use, so assignment is not automatically a valid instrument for a narrowly defined usage measure.
A practical distinction is between implementation evidence and causal mediation. Access logs can establish that the tool reached the intended workers. They do not, by themselves, identify how much of the outcome effect ran through the logged use. The same distinction applies to consulting recommendations, completed checklists, attendance, and training sessions.
Reform components and implementation: define the treatment before measuring success
Table 1:Reform records, required fields, and identification limits.
| Record / margin | What must be distinguished | Necessary fields and timing | Interpretation trap | Useful contrast |
|---|---|---|---|---|
| Reform assignment | Offer, eligibility, mandated adoption, voluntary use | Initial roster, assignment unit, strata, dates, exceptions | Calling users the treatment group | Assignment ITT versus separately qualified usage analysis |
| Technology content | Same name versus same version, features, data access and permissions | Version hash/date, enabled functions, tasks, outages | Treating updated tools as stable treatment | Version-specific or explicitly changing-regime effects |
| Complementary redesign | Review, discretion, staffing, support, pay, task allocation | Component ledger, standalone feasibility, rollout sequence | Calling a bundle contrast an interaction | Four feasible assigned combinations where appropriate |
| Implementation | Activated account, substantive use, competence, routine integration | Access logs, training, successful tasks, independent audit | Assuming login equals productive adoption | Delivery first stages distinct from causal mediation |
| Worker incentives | Owner savings versus worker income, time, risk and discretion | Pay schedule, task speed, training burden, compensation | Interpreting resistance as irrational | Directly measure who bears implementation costs Atkin et al., 2017 |
| Workflow capacity | Task speed versus completed system output | Arrivals, queues, handoffs, review, rework, quality | Summing task-time savings into firm output | Bottleneck-specific intervention and independent throughput |
| Organizational stock | Initial launch versus ongoing maintenance | Routines, manager transitions, staff turnover, support withdrawal | Practice counts equal value retained | Persistence under assignment histories Bloom et al., 2020 |
| Work arrangement | Full remote, hybrid option, geographic flexibility, schedule stability | Eligible jobs, attendance choice, approved location, shifts | Pooling unlike treatment bundles | Compare exact arrangements and populations |
| Resources and costs | Fixed setup, recurring support, time and real inputs, transfers | Costs by horizon and stakeholder; explicit terminal value | Endline productivity implies positive NPV | Net value under transparent horizon and ownership |
| Worker outcomes | Earnings, paid/unpaid time, strain, control, job stability | Initial cohort plus follow-up and response indicators | Inferring welfare from profit or retention alone | Independently measured conditions and survivor sensitivity |
| Scale and spillovers | Individual pilot versus team/firm-wide rollout | Collaborator exposure, shared infrastructure, treatment intensity | Assuming pilot effect is invariant to scale | Saturation or organizational rollout designs |
| Measurement system | More productive work versus more recorded activity | Old/new definitions, parallel audits, revision history | Accepting treatment-generated metrics as independent | Holdout quality audit unaffected by logging redesign |
Original teaching benchmark: gives a bundle gain of twelve and an interaction of thirteen. Neither can be substituted for the tool-only effect of minus four. All values are invented, on one fixed output scale.
2. Complementary practices: the model and the missing comparison
Milgrom and Roberts provide the conceptual reason to study configurations rather than isolated practices. Athey and Stern explain why observing practices together is not a sufficient empirical test of complementarity: firms can select both practices because of common unobserved returns or capabilities Milgrom & Roberts, 1990Athey & Stern, 2026. The latter framework circulated earlier as a working paper; the bibliography uses its September 2026 journal publication rather than presenting it as an entirely new idea.
Let be verified output or net value under a binary tool and redesign . On the chosen outcome scale, the average interaction is
Positive means the return to one component is larger with the other. It is not a claim that either component is beneficial alone. It is also outcome-scale specific: complementarity in units produced, logarithms of output, and net surplus need not be equivalent.
Original numerical example. Set . The tool alone reduces output by four; redesign alone raises it by three; the bundle raises it by twelve; and the interaction is thirteen. The tool’s effect with redesign is nine. Its equal-weighted factorial marginal effect is , not twelve. Redesign has effect sixteen with the tool, so its equal-weighted marginal effect is . A regression coefficient labeled “tool effect” must reveal which of these comparisons it represents.
Suppose the data contain only 00 and 11. The observed bundle gain of twelve is compatible with component/interaction effects , but also . The bundle is identified under a credible assignment; its decomposition is not. A factorial design can add the missing cells, but it must also have feasible and well-defined standalone treatments. A deliberately unusable “tool without necessary safety review” is not an ethically or economically meaningful comparison merely because it completes a table.
The steel-line study of Ichniowski, Shaw, and Prennushi and the IT/work-organization analysis of Bresnahan, Brynjolfsson, and Hitt offer influential observational evidence on systems of practices. Read them for the production and measurement logic as well as the remaining selection restrictions; do not relabel co-adoption patterns as randomized interactions Ichniowski et al., 1997Bresnahan et al., 2002.
3. Work design can move the bottleneck rather than eliminate it
A tool may improve one task while leaving the final deliverable constrained elsewhere. Consider an original two-stage production benchmark:
Here and are nonnegative capacities in items per period. Each finished item requires one drafting pass and one review pass; demand is sufficient, quality unchanged, and no other input binds. Initially both stages can process ten items. A drafting tool raises drafting capacity to twenty; throughput stays ten. A review redesign raises review capacity to sixteen; alone it still leaves throughput ten. Together throughput reaches sixteen. The six-unit gain is a workflow interaction in this constructed environment, before implementation costs and quality losses.
This simple model tells a researcher what to request: task arrival, queue length, processing time, handoffs, rework, completion, and downstream demand. A task-level time saving is not necessarily a firm-level output gain. Nor is a lack of output growth evidence that the saving has no value: it may reduce overtime, pressure, or resource use. Measure where the saved time goes.
Different digital tools can change information and communication differently. Bloom and coauthors’ analysis of information versus communication technologies motivates separating local problem-solving from escalation and coordination; its evidence is not a randomized claim that every digital tool should decentralize authority Bloom et al., 2014. In an AI setting, ask whether the relevant complement is review capacity, data access, training, discretion, or a revised workflow. Those candidate mechanisms should produce different intermediate outcomes.
4. Management interventions: assignment, implementation, and staying power
Bloom, Eifert, Mahajan, McKenzie, and Roberts randomize management consulting among textile firms/plants in India. The published study links the intervention to changes in practices and production, including quality, efficiency, and inventories. It is an unusually useful template for following implementation rather than treating a management score as self-explanatory Bloom et al., 2013.
The assigned intervention is assistance with a collection of practices, not separate randomization of every adopted routine. Production records within a plant improve outcome resolution but do not create additional independently assigned organizations. Students should reconstruct the firm’s and plant’s roles in assignment, implementation, spillovers, and inference before reproducing a specification. Consulting may also improve records, making independent outcome verification particularly valuable.
Bloom, Mahajan, McKenzie, and Roberts later revisit the setting. Many adopted practices have disappeared, but a treatment–control practice gap remains; the study also documents within-firm diffusion. Manager turnover and director time help explain reported persistence differences, but are not themselves randomly assigned mechanisms Bloom et al., 2020.
An original arithmetic example prevents a common misreading. Four practices contribute units in an additive illustration. Retaining the first two keeps half the practices but ninety percent of the value. Conversely, losing a critical complementary practice could erase much more than half the gain. A count of retained routines is not a welfare-retention fraction.
Broader contrasts help specify the treatment. Bruhn, Karlan, and Schoar study consulting for Mexican SMEs, where recommendations differ across firms. Iacovone, Maloney, and McKenzie compare individual and group-based consulting in Colombia, bringing delivery costs and peer-based implementation into the design. An offer of the same program need not deliver identical advice; a significant estimate in one arm and an insignificant estimate in another is not, by itself, a significant difference between the arms Bruhn et al., 2018Iacovone et al., 2022.
Giorcelli’s historical management and technology transfer study offers a longer horizon and distinct treatment content. Its identifying variation from an unexpected program budget cut is not a contemporary researcher-run factorial trial. Use it to ask which conclusions concern managerial knowledge, equipment, combinations, and their persistence under the paper’s historical comparison Giorcelli, 2019.
5. Why implementers may rationally resist a productive technology
Atkin and coauthors randomly introduce a material-saving cutting technology to soccer-ball producers in Pakistan. Slow adoption motivates a second experiment with payments to key workers conditional on demonstrating competence in front of the owner. The setting makes the distribution of adoption costs concrete: a piece-rated worker can lose income when a material-saving technique initially slows the task Atkin et al., 2017.
The sequence matters. The second randomization is conducted within the earlier technology-recipient group; it is not a fully crossed technology-by-permanent-pay-reform experiment. The second intervention combines a payment condition, a demonstration, and associated communication. The authors investigate alternative explanations. The design supports a role for incentive misalignment without making every owner decision or every intermediate belief separately randomized.
Original incidence example. A technique saves twelve monetary units of material but imposes a real implementation burden valued at four on the worker. Without compensation, the owner’s gain is twelve and the worker’s gain is minus four. A transfer of five changes these gains to seven and one, leaving the combined gain at eight. The transfer cancels in joint accounting; the real burden does not. This is a simplified sufficient-compensation example, not a claim that real workers’ disutility is known or transferable without limits.
Connect this to the earlier weeks carefully. Week 4 taught how reward schedules affect behavior; here the reward schedule determines whether a new production method can be implemented. Week 8 taught incidence and voice; here those margins are inputs into reform feasibility. A worker’s objection may reveal an uncompensated cost or a quality concern, not a cognitive failure.
6. Dynamics: transition costs, organizational capital, and persistence
A useful organizer distinguishes an intervention’s current effect from accumulated complementary capability:
Here is a deliberately abstract stock of routines, integration, or organizational knowledge; is its depreciation rate and is maintenance or investment. In the production function , and retain their access and redesign meanings, is labor input, and collects other measured inputs. The equation is a hypothesis-generating accounting device. Without additional variation and measurements, is not an identified residual called “organizational capital.” Maintenance can involve time, training, retention, documentation, and supervision.
Original stock example. Starting from one and with depreciation , no maintenance gives stocks . Maintenance of .2 each period holds the stock at one, but is not free. Changes in who remains employed can preserve or disrupt the stock; a study must follow both practices and people.
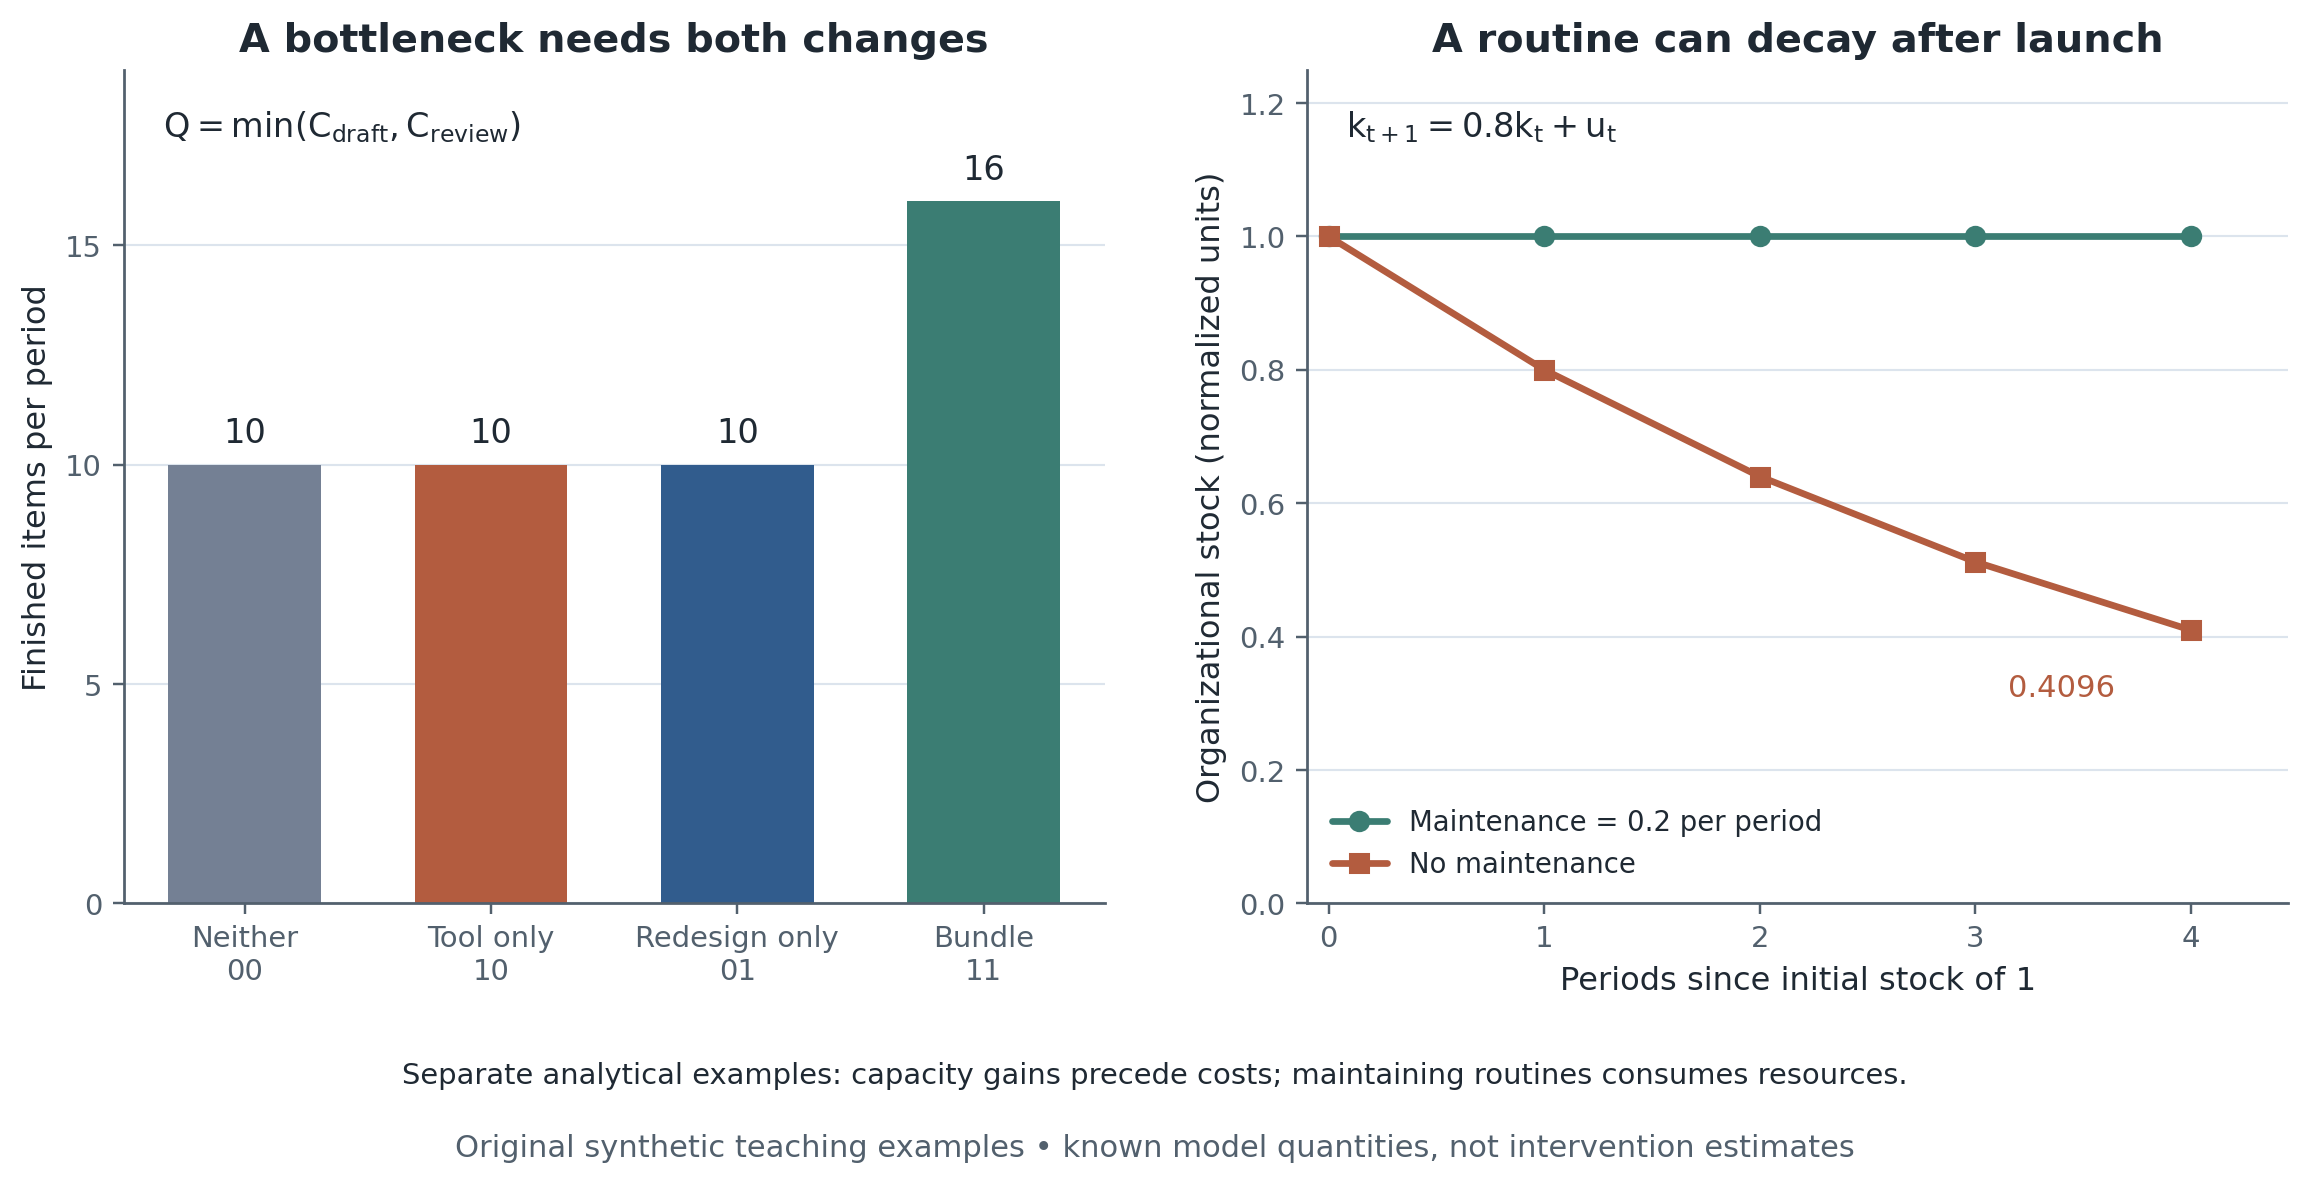
Figure 1:Bottlenecks and persistence: original synthetic teaching examples. The left panel uses capacities and plots their minimum, before costs and quality losses. The right panel starts at stock one with 20% depreciation; investment .2 each period preserves the stock but uses resources. These are known model quantities, not estimated intervention effects. Exact inputs are the four-cell CSV and maintenance CSV, rendered by the figure script.
For a decision-maker, an explicit finite-horizon value calculation is
Here is the evaluation horizon, the per-period discount factor, setup cost, recurring incremental cost, incremental benefit, and incremental terminal value. Define whose benefits, costs, and terminal value are included. Firm profit, worker welfare, and social value are different calculations. Transfers must not be counted as new resources.
Original transition example. Bundle benefits of over four periods, discount factor .95, setup cost twenty, no additional running costs, and zero terminal value give a net value of -1.74955. Treat benefits and costs as common monetary units in this calculation; it does not value unpriced worker conditions. A positive terminal output effect does not establish a positive return over the chosen horizon. A large unmeasured terminal value would change the conclusion; it must be defended rather than assumed.
The productivity J-curve framework makes intangible investment and measurement relevant to general-purpose technologies Brynjolfsson et al., 2021. It does not license a prediction that every early productivity loss will reverse. Test the proposed complementary investment and later outcomes; distinguish delayed delivery, implementation learning, adverse selection, and changed recording from a common verbal “J-curve.”
7. AI as a change in the work system
Use three contrasts instead of one claim that AI increases productivity.
A tool inside a defined production workflow. Brynjolfsson, Li, and Raymond study the staggered introduction of AI assistance in customer support. The published version reports gains in issues resolved per hour with heterogeneous speed and quality responses across worker groups Brynjolfsson et al., 2025. This is rollout-based evidence, not an individually randomized trial. The relevant comparison requires a credible untreated path, including assumptions about timing and other organizational changes. A task-specific productivity effect is not a measured change in economy-wide labor demand or a complete estimate of the return to redesigning the firm.
Individual access across many organizations. Dillon and coauthors randomize access to an integrated assistant across knowledge workers in multiple firms. The November 2025 revision distinguishes assigned access from use and documents changes in email and other work patterns Dillon et al., 2025. Treat the logged activities as activity measures: less email time does not directly identify more verified output. The study does not separately randomize all organizational complements, so limited changes in coordinated activities cannot uniquely identify which constraint prevented reorganization.
Task change alongside administrative labor outcomes. Humlum and Vestergaard link Danish adoption surveys to administrative records. Their March 2026 revision, now titled Still Waters, Rapid Currents, contrasts reported task reorganization with precise null estimates for earnings and recorded hours under its difference-in-differences design Humlum & Vestergaard, 2025. It is not an experiment assigning adoption, and the title change does not represent a second independent study. Stable averages over an early horizon do not imply that no organizational margin changes.
For each case request the version of the tool, the eligible population, support provided, choice of tasks, actual access date, utilization definition, quality audits, and peer exposure. Keep the data’s time resolution distinct from the assignment level. A million telemetry events do not make a million independently treated organizations.
Original time-accounting example. Email time falling from eight to six hours can accompany core-task time increasing from thirty to thirty-two, leaving total time unchanged, or remaining at thirty, reducing total time by two. Neither tells us output without a production measure. Similarly, unchanged output of two hundred units divided by recorded hours falling from one hundred to eighty produces a twenty-five-percent rate increase. Determine whether the denominator change is genuine time saving or simply changed logging before interpreting it.
8. Hybrid work, location flexibility, and scheduling are different interventions
Hybrid schedules as a defined offer
Bloom, Han, and Liang randomize access to a hybrid arrangement at Trip.com, with an option to work from home on specified days. The paper combines retention, satisfaction, performance grades, promotions, and code outcomes Bloom et al., 2024. Here the paper is revisited for reform timing, compliance, and outcome interpretation—not the Week 1 measurement lab.
The treatment is the offered arrangement, not mandatory identical attendance for everyone. After the experimental period the control group also receives access. Later comparisons therefore concern different assignment histories, not indefinite hybrid-versus-never-hybrid exposure. The paper uses equivalence analysis for specified performance outcomes; “no detected promotion difference” is not automatically an equivalence conclusion for every promotion measure.
Compare different arrangements rather than vote on remote work
Bloom, Liang, Roberts, and Ying’s earlier call-center experiment studies a different work arrangement among eligible volunteers; subsequent reselection is not the original random comparison Bloom et al., 2015. Emanuel and Harrington use the office-closure setting to separate changes in remote work from selection into it, under a distinct counterfactual and population Emanuel & Harrington, 2024. Choudhury, Foroughi, and Larson study geographic flexibility among patent examiners moving from work-from-home to work-from-anywhere, not from office work to home work Choudhury et al., 2021.
Gibbs, Mengel, and Siemroth connect personnel and activity records during the pandemic to work-from-home patterns among IT professionals. Their setting is valuable for measuring coordination and working time, but the before/during comparison should not silently become a randomized effect net of every concurrent pandemic change Gibbs et al., 2023.
Different results need not be contradictions. Reconstruct the treatment, task interdependence, volunteer margin, managerial practices, counterfactual, and horizon before comparing estimates. Do not explain every discrepancy ex post with an unmeasured “culture” variable.
Scheduling redesign and worker conditions
Kesavan and coauthors study a multicomponent responsible-scheduling intervention at Gap stores. The randomized bundle speaks to store performance and staffing practices, not separate causal effects of every predictability, consistency, adequacy, or control component Kesavan et al., 2022. Use the published 2022 mean estimates when discussing that article; do not substitute a different statistic from an earlier project report.
Kelly and coauthors’ work-family intervention combines supervisor support with changes in control over working time. It brings work-family conflict and perceived control into the outcome system, rather than inferring them from sales or retention Kelly et al., 2014. As elsewhere, an assigned bundle can be policy-relevant even when its components are not individually identified.
Paper, design, and evidence map
Read each row as question → variation → estimand/evidence → remaining limitation, not as a ranking of practices.
Table 2:Organizational reforms: interventions, identifying comparisons, and limits.
| Paper | Organizational question and variation | What the evidence can speak to | What must not be inferred |
|---|---|---|---|
| Bloom et al. 2013 Bloom et al., 2013 | Randomized management consulting in Indian textiles | Assigned assistance, implementation, and plant performance | Separately randomized effects of each adopted practice; independent treatment per daily record |
| Bloom et al. 2020 Bloom et al., 2020 | Follow-up of the earlier intervention | Persistence and diffusion under original histories | Randomly identified manager-turnover mechanism; equal value of every retained practice |
| Atkin et al. 2017 Atkin et al., 2017 | Technology provision followed by a worker-payment experiment among recipients | Implementation barriers and response to a conditional incentive intervention | A fully crossed permanent pay × technology trial or a uniquely isolated communication mechanism |
| Giorcelli 2019 Giorcelli, 2019 | Historical management/equipment transfer with budget-cut variation | Long-horizon responses under an explicit historical counterfactual | A modern researcher-randomized factorial intervention |
| Bruhn et al. 2018 Bruhn et al., 2018 | Consulting offer to Mexican SMEs | Effects of a program whose advice can be tailored | Every firm receives the same practice treatment |
| Iacovone et al. 2022 Iacovone et al., 2022 | Individual versus group consulting in Colombia | Delivery-mode comparisons, costs, and organizational outcomes | Difference between arms from significance labels alone |
| Ichniowski et al. 1997 Ichniowski et al., 1997 | HR-practice configurations in steel lines | Detailed workplace systems and productivity associations under the design’s restrictions | Random assignment of practice bundles |
| Bresnahan et al. 2002 Bresnahan et al., 2002 | Firm IT, work organization, and skills | Joint measurement and empirical complementarity patterns | Causal interaction from co-adoption alone |
| Bloom et al. 2014 Bloom et al., 2014 | Distinct information and communication technologies | Different channels involving information, authority and coordination | Every digital tool has the same decentralization effect |
| Brynjolfsson et al. 2025 Brynjolfsson et al., 2025 | Staggered AI-assistance rollout in customer support | Defined workflow productivity and heterogeneous quality/speed responses | An RCT; unrestricted full-firm or labor-demand effect |
| Dillon et al. 2025, Nov revision Dillon et al., 2025 | Individual AI access randomized across firms | Offer effects and qualified use analyses of work patterns | Email time equals output; organizational complement itself randomized |
| Humlum–Vestergaard, Mar 2026 revision Humlum & Vestergaard, 2025 | Survey-linked Danish administrative data, DiD | Early task change alongside earnings and recorded-hour estimates | Random adoption; no task change because average earnings are stable |
| Bloom–Han–Liang 2024 Bloom et al., 2024 | Randomized specified-day hybrid option | Retention and multiple performance/conditions outcomes | Mandatory identical usage; controls remain untreated after crossover; all nulls establish equivalence |
| Bloom et al. 2015 Bloom et al., 2015 | Remote-work experiment among eligible call-center volunteers | Assignment effect for a particular arrangement and workforce | Subsequent reselection is the same random contrast |
| Emanuel–Harrington 2024 Emanuel & Harrington, 2024 | Office closure and pre-existing remote versus onsite status | Separation of treatment and selection under its counterfactual | Pandemic closure randomly assigns all aspects of work organization |
| Choudhury et al. 2021 Choudhury et al., 2021 | WFH to work-from-anywhere among patent examiners | Additional geographic flexibility in that institutional setting | Onsite-to-home treatment or a universal remote-work result |
| Gibbs et al. 2023 Gibbs et al., 2023 | Personnel and activity records around pandemic WFH | Rich coordination/time/output measurement | A before–after contrast isolates WFH from concurrent shocks |
| Kesavan et al. 2022 Kesavan et al., 2022 | Randomized responsible-scheduling package in retail | Store outcomes under a multicomponent intervention | One component receives all causal credit; early-report medians equal journal means |
| Kelly et al. 2014 Kelly et al., 2014 | Group-randomized support and work-time redesign | Worker control and work-family outcomes of a bundle | Pure WFH permission or a separately randomized supervisor-support effect |
Methods rather than empirical interventions: Milgrom–Roberts organizes complementarity; Athey–Stern addresses empirical identification of it; Brynjolfsson–Rock–Syverson motivates intangible-investment accounting. None makes an arbitrary organization’s implementation story self-validating Milgrom & Roberts, 1990Athey & Stern, 2026Brynjolfsson et al., 2021.
9. Data architecture and feasible research opportunities
Management surveys provide a starting language for practices, while linked operational and personnel records reveal how change reaches work. WMS materials and the Census MOPS questionnaires help students formulate data requests; questionnaire availability is not access to confidential identified establishment records Bloom & Van Reenen, 2007World Management Survey, n.d.U.S. Census Bureau, n.d.. Published archives also differ: a replication code archive may omit the employer’s proprietary underlying files.
Data, measurement, and access map
Table 3:Reform evaluation data: measurement objects, failure modes, and access.
| Data object | Minimum useful fields | What becomes measurable | Failure to anticipate | Resource / access distinction |
|---|---|---|---|---|
| Eligible worker/establishment roster | Stable identifiers, initial eligibility, assignment strata, role and location | Initial-cohort ITT, exposure and follow-up denominators | Rebuilding the cohort after adoption or closure | Partner records; use synthetic rosters for unrestricted teaching |
| Intervention component/version ledger | Announcement, activation, support, compensation, exceptions, version, end dates | Assigned bundle and treatment histories | A shared name conceals changing treatment | Research agreement and logs, not a generic downloaded dataset |
| Implementation logs | Accounts, use events, competence, routine audits, outages | Delivery and utilization first stages | Logging policy changes masquerade as adoption | Confidential or vendor-controlled; document privacy and export terms |
| Workflow and task records | Arrival, handoff, review, completion, quality, revisions, case complexity | Bottlenecks, substitution, rework and throughput | Conditioning on tasks selected after treatment | Independent random task audits can complement platform records |
| Payroll and time | Contractual rates, hours, overtime, unpaid work survey, earnings, entry/exit | Distribution of transition costs and time savings | No telemetry interpreted as no work | Obtain only authorized linkage; do not upload confidential logs to public models |
| Management-practice measurement | Question text, scoring rubric, interviewer procedure, version, coverage | Comparable practice families | Scores treated as causal treatments or cardinal welfare | WMS survey/data resources World Management Survey, n.d.Bloom & Van Reenen, 2007 |
| Establishment management and organization | Survey weights, wave, practices, employment and plant links | Broad distributions and externally comparable margins | Public questionnaires confused with unrestricted microdata | Census MOPS program and documentation; identified microdata restricted U.S. Census Bureau, n.d. |
| Hybrid-work trial archive | Assignment, linked outcome files, dates, variable labels | A bounded empirical replication with documented endpoints | Assuming all later periods retain untreated controls | Nature author data/code repository identified; not downloaded here Bloom et al., n.d. |
| Work-family intervention archive | Randomization units, wave, response, intervention components, outcome scales | Worker conditions and implementation of a bundle | Mixing two employers or randomization levels indiscriminately | WFHS ICPSR36158.v2 has public-use documentation/files subject to terms; not downloaded here Work, Family, and Health Network, 2018 |
| Long-run follow-up | Closed/surviving units, retained routines, staff transitions, support cessation | Persistence and selective observation | Comparing survivors as the original population | Follow-up article/AEA archive pointer, not assumed complete open microdata Bloom et al., 2020 |
| Activity analytics | App/meeting/email definitions, concurrent windows, missing-device coverage | How recorded working patterns change | Duplicate concurrent time or unrecorded off-platform effort | Gibbs et al. code pointer does not release all underlying employer data Gibbs et al., 2023 |
| Cost and incidence ledger | Setup, ongoing resources, transfers, maintenance, quality losses, horizon | Firm/worker/joint accounting | Summing wage transfers twice or assuming terminal value | Original synthetic exercise plus project-specific authorized cost records |
Access standard: An article, questionnaire, code archive, and unrestricted microdata release are four different resources. This pack verifies primary pointers and versions. It does not claim to have downloaded or executed original microdata or estimation programs.
The following are proposed research directions, not claims that these designs have already been executed.
Component bottlenecks. Randomize a tool and feasible review/support redesign where the partner can supply both standalone arms. Prespecify throughput, independent error audits, queue length, review time, and worker burden. A positive interaction in output but not net value would be informative, not a failed study.
Maintenance after the launch team leaves. At a planned transition, randomize continued implementation support across units while preserving an initial cohort. Measure actual routines, staff changes, costs, and output. This distinguishes maintenance from a convenient association between manager turnover and decline. Anticipated withdrawal and support spillovers require explicit treatment histories.
Who bears the transition? Combine access assignment with credible measures of setup time, wage schedules, skill demands, and worker control. An optional worker-compensation component can test feasibility, but treat its information and incentive content explicitly. Do not assume that all opposition would disappear with better messaging.
Coordinated versus individual rollout. Compare feasible rollout intensities across teams, not merely users and nonusers within a partly treated team. The question is whether peer availability changes the value of access. Preserve the rollout regime as the treatment and measure effects on untreated collaborators.
Recording changes versus real redesign. During a workflow-system migration, run an independent parallel audit of deliverables before and after the software change. Preserve old and new definitions on an overlap sample. This creates a way to distinguish changes in logging from changes in quality, rather than adjusting a headline index until the results agree.
Research Lab
Primary design anchor
Use Atkin and coauthors for the problem of implementation incentives, with Bloom and coauthors for following practices over time. The guaranteed exercise is an original synthetic factorial rollout, not either paper’s data, treatment protocol, or empirical estimate Atkin et al., 2017Bloom et al., 2013Bloom et al., 2020. A real-archive extension requires its own verified version, access conditions, and named result.
Reproduce
Twelve establishments are grouped into three baseline blocks of four. Each block receives one establishment in each cell: neither intervention, tool only, redesign only, and both. Potential outcomes are fixed before the separately seeded assignment. Students reconstruct baseline-adjusted cell contrasts and four-period paths from the observed panel.
At the final horizon the invented population has standalone tool effect minus four, standalone redesign effect three, bundle effect twelve, and interaction thirteen. A realized sample estimate need not equal those population values. Students calculate conditional component effects, equal-weighted factorial marginal effects, the bundle contrast, and the interaction rather than labeling all of them “the treatment effect.” Instructor-only potential outcomes audit repeated-assignment properties; they are not available to an empirical researcher.
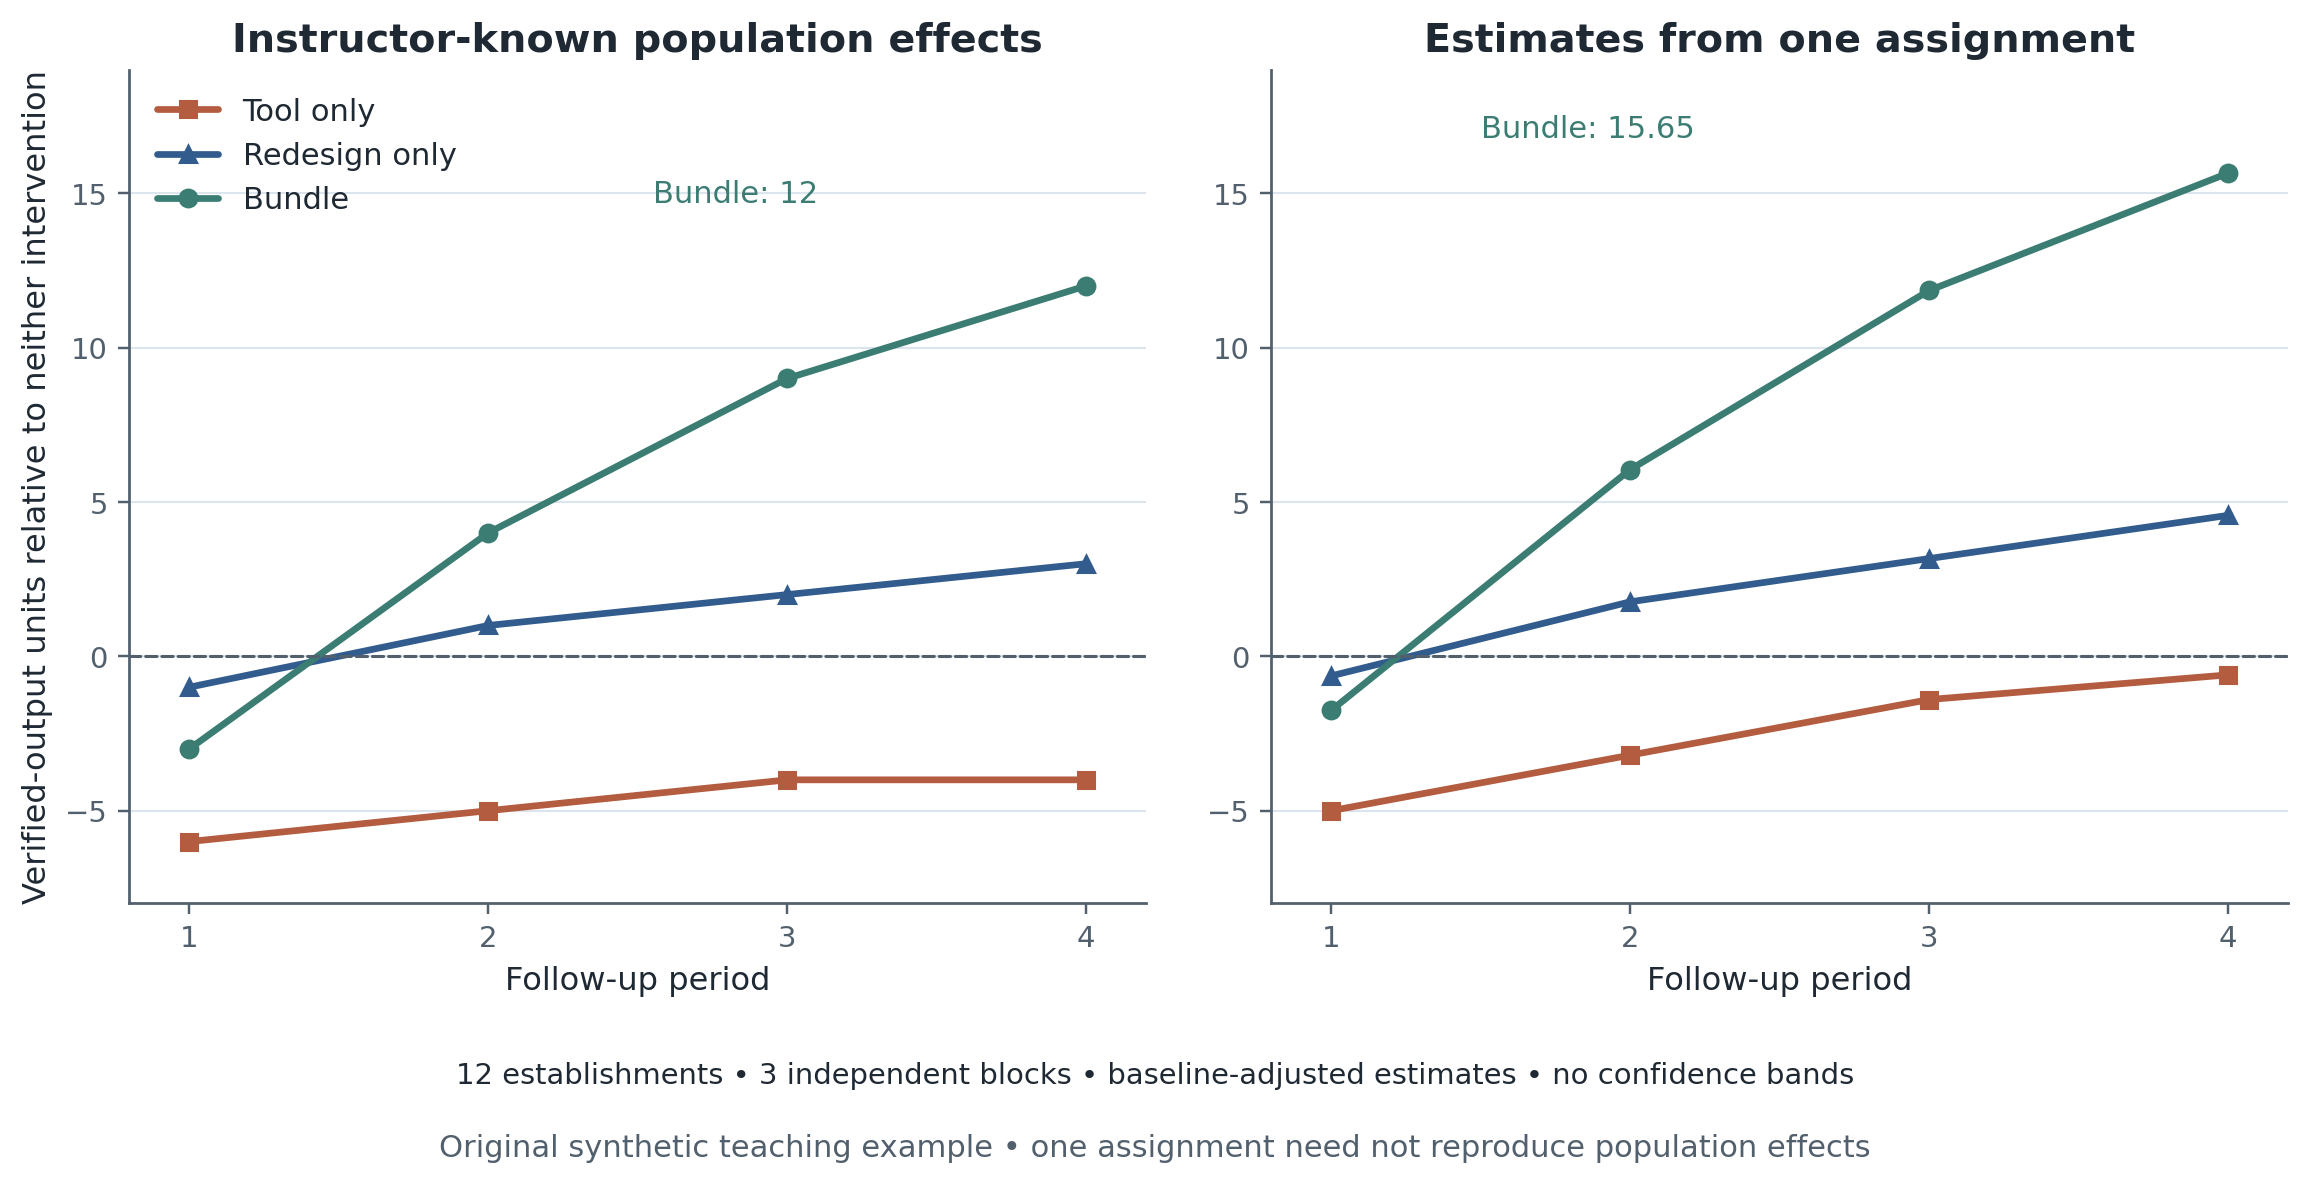
Figure 2:Dynamic reforms: an original synthetic teaching example. Both panels show verified-output units relative to neither intervention. The left displays instructor-known population effects; the right shows baseline-adjusted estimates from one assignment of twelve establishments in three independent blocks. Estimates need not equal truth. Three blocks do not justify automatic normal confidence bands; none are plotted. Read the realized estimates CSV and separately labeled instructor truth CSV; the figure script preserves both inputs exactly.
Diagnose
Enumerate all permitted allocations. The Fisher test holds the observed outcomes fixed under the global sharp null that neither factor affects any establishment. Computing an interaction statistic under that null does not test only zero interaction while allowing arbitrary nonzero main effects. Students must write down the null before interpreting the output.
Report the standard error of the mean of three independent block contrasts, with its very limited replication. The oracle audit checks unbiasedness and the variance estimator’s conservativeness in repeated assignments; it does not certify a normal approximation from three blocks. Enumeration does not increase the number of establishments or independent blocks.
Additional diagnostics reconstruct the bottleneck, transition-value, maintenance, recording, selective-stayer, equivalence, and spillover examples. Utilization is explicitly a post-assignment variable; no as-treated causal effect is supplied.
Transfer
Write a two-page reform-evaluation plan and a one-page component/outcome ledger. Specify the initial population, assignment unit, observed combinations, primary contrast, transition and persistence horizons, costs, independent quality, and worker conditions. Add an explicit spillover map and a plan for exits, closures, survey nonresponse, and control crossover. Name one result that would change the organization’s decision and one result that would distinguish two competing mechanisms.
Methods Box
A. Match the estimand to the intervention that was assigned
For a binary offer, the intention-to-treat effect at horizon is under the relevant randomization and observation conditions. It includes implementation under that offer. A first stage measures whether access or use changed; it is not a mechanism decomposition. A conditional comparison among users selects on post-assignment behavior. Assignment-as-IV requires a carefully specified treatment and exclusion restriction, which support, reassurance, training, or peer use may violate.
For the factorial rollout, let and denote the two assigned factor indicators, distinct from actual access, redesign delivery, or use. Let be the fixed-horizon change from the pretreatment baseline and the baseline block. Subtracting the baseline can improve precision; random assignment supplies identification. A descriptive estimating form saturated in the four assigned cells, with block intercepts, is
Here is a block intercept and the residual. With randomized, balanced cells and the specified outcome, estimates the tool effect when and estimates its effect when . The bundle is . Report cell means and assignment weights alongside the regression. In this lab, each cell mean averages its one establishment per block, giving the three equal-sized blocks equal weight; the target averages establishments, not workers or transactions. With unequal cell probabilities or sizes, state whether aggregation targets people, establishments, or assignment probabilities; the software coefficient need not equal the intended average. Post-treatment actual use must not quietly replace or .
B. Reconstruct treatment histories before drawing an event-study graph
Dates for announcement, delivery, first login, intensive support, stable routine use, and eventual control crossover can differ. Choose the date matching the estimand. Backdating adoption to first successful use selects on implementation outcomes; using rollout eligibility may identify an offer rather than an active-use effect. Retain the alternative dates for descriptive first stages rather than trying several until a preferred graph appears.
With nonrandom staggered adoption, state why untreated potential outcomes should follow the comparison group’s trend. Callaway–Sant’Anna provides an implementation framework for absorbing adoption with heterogeneous group-time effects, not a cure for endogenous rollout, anticipation, spillovers, changing treatment versions, or treatment reversal Callaway & Sant'Anna, 2021. Define never-/not-yet-treated controls and supported event-time windows. If treatment is suspended or a control later receives the tool, revisit the treatment-history model; do not force a one-time-adoption estimator onto an incompatible process.
A statistically insignificant pretrend test is not evidence that the counterfactual trend restriction is true. Report the magnitudes and uncertainty of pre-period differences and the institutional timing argument. Selecting specifications because they pass a pretest can itself distort inference Roth, 2022.
C. Put spillovers and rollout scale into the design
For team , use only after defining exposure : treated collaborators, shared supervisor support, shared software infrastructure, or workload transferred from others. An individual-access comparison at a pilot’s treatment share is not generally the effect of switching the entire organization.
In an original illustration , the direct effect at fixed exposure is two, whereas all-treated versus none-treated changes the outcome by six. The difference is not estimator bias; it is a different policy object. When interference is plausible, randomize rollout intensity or organizational units, track cross-boundary links, and name the assumptions that make clusters independent. A larger cluster may reduce contamination but leave fewer independent assignments.
D. Preserve an outcome system, not a dashboard winner
Prespecify one primary organizational endpoint and a small set of separately interpretable outcome families. Include quality verified outside the treated measurement tool, total output, time and other inputs, worker conditions, and implementation costs. Keep original units: a percentage change in a rate is not a percentage-point change in a probability. An index can reduce multiple testing but cannot make incomparable welfare units commensurate.
Use raw numerators and denominators. In an original recording-only example, logged completed actions rise from one hundred to one hundred fifty while independent audited deliverables stay one hundred. A system-defined output gain of fifty percent then measures recording change, not necessarily production. Maintain versioned definitions and an overlap audit when software changes what gets logged.
A working-time measure may miss off-platform, unpaid, or home-based work. Avoid interpreting absence from telemetry as leisure. Survey timing and response are additional measurement layers, especially when implementation changes who has time to respond.
E. Treat exits, closures, and selective assessment as outcomes and missingness
Follow the initial eligible cohort for retention and earnings where possible, and separately report current-staff composition. Productivity among stayers is not an initial-cohort treatment effect. An original workforce with outputs has mean one hundred ten and total four hundred forty. Keeping only the last two raises the workplace mean to one hundred thirty while reducing the total to two hundred sixty; no individual improved.
Do not assign zero to a missing destination wage, unknown health response, or unobserved off-platform task. Closure can legitimately imply zero production at that establishment for a defined output measure, but does not imply zero income or welfare for every former worker. State the support of each outcome after exit.
Lee bounds require a substantive monotonic selection argument and the relevant assignment assumptions; opposing exits under a reform can violate that argument Lee, 2009. Report response and follow-up by assignment, maintain an attrition ledger, and show sensitivity tied to plausible missing outcomes rather than presenting a generic correction as definitive.
F. Choose inference and nulls before counting records
Match uncertainty to assignment and shared shocks. Worker-day or transaction-level records can improve measurement while leaving only a small number of independent firms, teams, or matched blocks. The cluster guidance in Cameron–Miller is a starting resource; small numbers of clusters and highly uneven leverage remain substantive limitations Cameron & Miller, 2015. Retain assignment strata, clustering identifiers, and the randomization algorithm.
For the lab’s three independent blocks, let be a cell contrast and its block average. Report
Under this original independent blocked design it is conservative in expectation for the finite-population average when true block contrasts differ; that does not guarantee accuracy in the realized tiny sample. The exact sharp-null test answers a different question from an asymptotic confidence interval for an average interaction. Do not bootstrap individual records as if they were independent assignments or use unrestricted permutations that violate the original allocation rule.
G. Distinguish equivalence, persistence, and successful implementation
A nonsignificant zero-effect test does not demonstrate an acceptably small effect. Choose a meaningful equivalence margin before outcomes, justify its scale, and use a suitable equivalence procedure. In an original normal-approximation illustration with estimate .1, a standard error of .2 gives a ninety-percent interval approximately , inside a prespecified margin. A standard error of two gives , which does not establish equivalence. Both zero-effect tests can be nonsignificant. This normal illustration is separate from the three-block lab and does not supply a valid confidence procedure for that tiny design.
Persistence needs its own estimand. Is the question continued assignment, continued access, retained routines after support stops, or a lasting difference after controls catch up? Manager replacement, worker exit, technology updates, and reorganization can be part of the effect rather than harmless controls. Report intermediate outcomes without conditioning away post-treatment channels from the primary total effect. Match the study horizon to setup and maintenance costs; distinguish a temporary pilot from a steady-state policy.
Operational methods and identification checklist
Table 4:Operational design choices and the assumptions each leaves unresolved.
| Problem | Useful design / diagnostic | Implementation rule | Limit that remains |
|---|---|---|---|
| Bundle versus components | Feasible 2×2 assignment or explicit multiarm comparison | Publish cell means, assignment probabilities and target contrast | Two-arm bundle trial cannot identify all components/interactions |
| Endogenous co-adoption | Separate source of variation for practices or disciplined structural restrictions | Inspect support for mixed cells and correlated returns | Controls or better prediction alone do not establish complementarity Athey & Stern, 2026 |
| Use versus access | Assignment ITT plus delivery/use first stages | Freeze initial eligibility, record access and separate utilization | Access-as-IV may fail exclusion; users are selected |
| Sequential experiments | Reconstruct each eligible sample and timing | State which earlier arm enters the later randomization | Not interchangeable with a full baseline factorial design Atkin et al., 2017 |
| Nonrandom staggered adoption | Group-time comparisons with explicit parallel-trend assumptions | Specify absorbing treatment, comparison cohorts, weights, anticipation and support | Estimator choice does not solve endogenous rollout or versions Callaway & Sant'Anna, 2021 |
| Pretrend screening | Report uncertainty, design history and sensitivity | Do not select specifications by a pretest pass | Low power and pretest selection distort reassurance Roth, 2022 |
| Control crossover | Define histories and horizon-specific contrasts | Keep crossover and support-ending dates visible | Long-run original-assignment effect is not permanent treatment-versus-never-treatment |
| Spillovers | Organizational or saturation assignment; exposure ledger | Define collaborators, shared resources and boundary assumptions | Individual pilot effect need not equal full-rollout effect |
| Common shocks / few organizations | Assignment-aware clustered or blocked inference | Count firms/teams/blocks, not raw transactions; preserve randomization | Few independent units can limit precision and asymptotics Cameron & Miller, 2015 |
| Exact tests | Reassign as the protocol allows; hold observed outcomes fixed under a sharp null | Name the full sharp null and statistic | Interaction statistic under global null is not a zero-interaction-only test |
| Persistence and maintenance | Planned support withdrawal / maintenance comparison where feasible | Measure routines, quality, people and recurring costs | Endogenous manager turnover is not an isolated persistence mechanism |
| Recording / denominator changes | Parallel independent audits and raw counts | Version output definitions; report hours, output and quality separately | Rates can rise because logging or population changed |
| Attrition / closure / selective assessment | Initial-cohort outcomes, response ledger, defensible bounds | Separate true zero establishment production from unobserved worker outcomes | Lee bounds need monotonic selection, not just observed attrition rates Lee, 2009 |
| Equivalence / noninferiority | Prespecified economically meaningful margin and suitable confidence procedure | State scale, endpoint, population and follow-up | Nonsignificant zero-effect test is not equivalence |
| Many outcome families | Prespecified primary endpoint and family-level multiplicity plan | Keep quality and worker outcomes visible even when primary output improves | A composite is not automatically welfare; cherry-picked subgroup stories remain possible |
| Portability to rollout | Record workforce, task interdependence, incentives, complement availability | Separate observed evidence from explicit rollout hypotheses | Larger scale may change congestion, tasks, costs and selection |
Proposal requirement: A reform evaluation must specify at least one verified production outcome, one independent quality or worker-conditions family, and both a spillover plan and an attrition plan. Explain what would distinguish two competing mechanisms rather than promising to control for every mediator.
Reading Ladder And References
Three required readings: Bloom and coauthors on the management experiment; Atkin and coauthors on organizational barriers to technology adoption; Brynjolfsson, Li, and Raymond on AI within a production workflow. For each, prepare a one-page contract specifying intervention, assignment/comparison, implementation, endpoint, horizon, and remaining identification threat Bloom et al., 2013Atkin et al., 2017Brynjolfsson et al., 2025.
Focused companion discussion: Bloom–Han–Liang on the hybrid-work offer and outcome interpretation, and Bloom–Mahajan–McKenzie–Roberts on persistence. These are distinct research questions, not additional generic “productivity” examples Bloom et al., 2024Bloom et al., 2020.
Foundations and presentations: Milgrom–Roberts and Athey–Stern for complementarity; steel and IT practices for observational configurations; Mexico, Colombia, and historical transfer for implementation settings; scheduling and work-family interventions for non-output endpoints; recent AI studies for the distinction between activity change and labor outcomes. Methods references are resources to consult when a design needs them, not a second econometrics syllabus.
Reading and laboratory map
Table 5:Required readings, companion discussions, presentation pathways, and lab tasks.
| Layer | Readings / resources | Preparation task |
|---|---|---|
| Required 1: assigned assistance and implementation | Bloom et al. 2013 Bloom et al., 2013 | Draw firm/plant/record units; distinguish randomized package from adopted components |
| Required 2: incentives to implement | Atkin et al. 2017 Atkin et al., 2017 | Draw the two experiment timelines and identify what the second comparison conditions on |
| Required 3: AI inside production | Brynjolfsson–Li–Raymond 2025 Brynjolfsson et al., 2025 | Write rollout counterfactual, outcome denominator, quality endpoint and heterogeneity interpretation |
| Focused companion: arrangement and horizon | Bloom–Han–Liang 2024 Bloom et al., 2024 | Define the offer, choice, control crossover and which outcomes use equivalence tests |
| Focused companion: persistence | Bloom et al. 2020 Bloom et al., 2020 | Distinguish persistent assignment contrast from causes of practice retention |
| Theory excerpts | Milgrom–Roberts; Athey–Stern; productivity J-curve Milgrom & Roberts, 1990Athey & Stern, 2026Brynjolfsson et al., 2021 | Specify complementarity scale and the unobserved comparison; do not infer eventual payoff from early loss |
| Systems-of-practices presentation | Steel-line, IT/skills, IT-versus-communication, management measurement Ichniowski et al., 1997Bresnahan et al., 2002Bloom et al., 2014Bloom & Van Reenen, 2007 | Explain design-specific selection restrictions rather than treat joint adoption as a randomized test |
| Development / delivery presentation | Historical transfers, Mexico and Colombia consulting Giorcelli, 2019Bruhn et al., 2018Iacovone et al., 2022 | Compare what was actually delivered, to whom, at what cost and horizon |
| Work-arrangement presentation | Call-center experiment, selection versus treatment, geographic flexibility, IT analytics Bloom et al., 2015Emanuel & Harrington, 2024Choudhury et al., 2021Gibbs et al., 2023 | Write four distinct treatment contracts rather than pool “remote work” effects |
| Scheduling / worker-outcome presentation | Responsible scheduling and work-family redesign Kesavan et al., 2022Kelly et al., 2014 | Distinguish bundle effects, objective outcomes and subjective worker conditions |
| Current AI extension | Dillon et al. Nov2025; Humlum–Vestergaard Mar2026 Dillon et al., 2025Humlum & Vestergaard, 2025 | Compare access, use, logged time, task change and administrative outcomes; cite exact versions |
| Methods resources | Lee; Callaway–Sant’Anna; Cameron–Miller; Roth Lee, 2009Callaway & Sant'Anna, 2021Cameron & Miller, 2015Roth, 2022 | State the problem each addresses and the assumptions it does not remove |
| Data resources | WMS, MOPS, hybrid trial repository, WFHS World Management Survey, n.d.U.S. Census Bureau, n.d.Bloom et al., n.d.Work, Family, and Health Network, 2018 | Verify access, unit, coverage and whether code or data are actually supplied |
| Reproduce | Original 12-establishment factorial simulation | Reconstruct eight contrasts; the data are invented, not a published study |
| Diagnose | 13,824 legal assignments and explicit numerical examples | Separate global-null randomization tests, average contrasts, dynamics and selected outcomes |
| Transfer | Two-page reform proposal plus ledger | Add spillovers, attrition, independent quality/worker outcomes and a decision-relevant horizon |
The 28 scholarly entries form a research library, not a 28-paper compulsory assignment. Hoffman–Stanton remains the overarching review Hoffman & Stanton, 2025. Three required papers receive full design discussion; presentations and resources are chosen to match students’ projects.
Exercises And Discussion Prompts
Using the four-cell example, compute standalone, conditional, factorial-marginal, bundle, and interaction effects. Which can be recovered from a two-arm bundle trial?
Draw the timeline of the two Pakistan experiments. Which interpretation would incorrectly require a fully crossed design or permanent wage reform?
Design a task/worker/team outcome system for an AI rollout. Show two explanations for fewer email hours that imply different welfare or production conclusions.
Explain why the management follow-up and a randomly assigned maintenance intervention would answer different questions.
Compare hybrid access, full remote work, geographic flexibility, and predictable scheduling. Define a counterfactual for each rather than rank their treatment labels.
Write an equivalence margin for an independent quality measure. What data would distinguish a small loss from an imprecisely estimated loss?
Formulate a spillover-aware reform evaluation with attrition and control crossover. Specify an outcome that would challenge the partner’s preferred interpretation.
Reproducibility And Code Lab Note
Download the teaching repository (ZIP), or clone the repository. Keep its folder structure and open books/special-topic8-organizational/labs/09-organizational-change-and-work-design/; the lab README supplies the run instructions. Weeks 1–3 use the shared plotting module supplied with the repository.
Use the Week 9 lab handout, lab README, and transfer memo template. The guaranteed route is an original synthetic factorial design, with empirical_replication: false. The standard-library Python generator fixes potential outcomes before assignment, separates learner records from instructor truth, preserves all 82 supplied assertions, and refuses nonempty output targets. A staging installer regenerates declared artifacts while preserving authored work.
Run from this book directory in the existing research environment:
ENV_NAME=research bash labs/09-organizational-change-and-work-design/smoke.sh
conda run -n research python assets/scripts/build-week9-work-design.py
Smoke checks two fresh default-seed runs, seed 88771, actual Python compilation, and exit-2 overwrite refusal with unchanged files. The global sharp-null test and the instructor potential-outcome enumeration remain separate. Neither statistical significance nor equality between a realized estimate and population truth is a passing criterion. Figure inputs are exact generated CSVs; all displayed data and model parameters are invented.
Public article and archive pointers are recorded in the bibliography and verification ledger. The Nature hybrid-work article identifies data and code at its author repository; WFHS provides a documented archive Bloom et al., n.d.Work, Family, and Health Network, 2018. Original microdata and original estimation programs were not downloaded or executed for this week. A future empirical extension requires its own verified version, permissions, file coverage, dependencies and named reproduction target.
Slide Companion Note
The Week 9 slide deck (PDF) and Beamer source follow reform records → component comparisons → bottlenecks and incentives → transition and maintenance → empirical designs → spillovers, attrition and inference → research proposal. The deck uses the original figures and develops the three required papers’ treatment contracts and remaining limitations.
Compile from this book directory:
conda run -n research latexmk -cd -pdf -interaction=nonstopmode slides/week9/09-organizational-change-and-work-design.texBridge Forward
Week 9 turns the previous weeks’ mechanisms into reform evaluations: what was changed, what was implemented, what persisted, and who benefited or bore costs. Week 10 will use that discipline to build and defend research proposals, connect one-organization evidence to broader economic mechanisms, and assess feasibility, portability, confidentiality, and the course’s frontier questions.
- Hoffman, M., & Stanton, C. T. (2025). People, Practices, and Productivity: A Review of New Advances in Personnel Economics. In Handbook of Labor Economics (Vol. 6, pp. 729–818). Elsevier. 10.1016/bs.heslab.2025.07.005
- Atkin, D., Chaudhry, A., Chaudry, S., Khandelwal, A. K., & Verhoogen, E. (2017). Organizational Barriers to Technology Adoption: Evidence from Soccer-Ball Producers in Pakistan. Quarterly Journal of Economics, 132(3), 1101–1164. 10.1093/qje/qjx010
- Bloom, N., Mahajan, A., McKenzie, D., & Roberts, J. (2020). Do Management Interventions Last? Evidence from India. American Economic Journal: Applied Economics, 12(2), 198–219. 10.1257/app.20180369
- Milgrom, P., & Roberts, J. (1990). The Economics of Modern Manufacturing: Technology, Strategy, and Organization. American Economic Review, 80(3), 511–528. https://www.gsb.stanford.edu/faculty-research/publications/economics-modern-manufacturing-technology-strategy-organization
- Athey, S., & Stern, S. (2026). An Empirical Framework for Testing Theories about Complementarity in Organizational Design. Journal of Organization Design. 10.1007/s41469-026-00206-x
- Ichniowski, C., Shaw, K., & Prennushi, G. (1997). The Effects of Human Resource Management Practices on Productivity: A Study of Steel Finishing Lines. American Economic Review, 87(3), 291–313. https://www.gsb.stanford.edu/faculty-research/publications/effects-human-resource-management-practices-productivity
- Bresnahan, T. F., Brynjolfsson, E., & Hitt, L. M. (2002). Information Technology, Workplace Organization, and the Demand for Skilled Labor: Firm-Level Evidence. Quarterly Journal of Economics, 117(1), 339–376. 10.1162/003355302753399526
- Bloom, N., Garicano, L., Sadun, R., & Van Reenen, J. (2014). The Distinct Effects of Information Technology and Communication Technology on Firm Organization. Management Science, 60(12), 2859–2885. 10.1287/mnsc.2014.2013
- Bloom, N., Eifert, B., Mahajan, A., McKenzie, D., & Roberts, J. (2013). Does Management Matter? Evidence from India. The Quarterly Journal of Economics, 128(1), 1–51. 10.1093/qje/qjs044
- Bruhn, M., Karlan, D., & Schoar, A. (2018). The Impact of Consulting Services on Small and Medium Enterprises: Evidence from a Randomized Trial in Mexico. Journal of Political Economy, 126(2), 635–687. 10.1086/696154
- Iacovone, L., Maloney, W. F., & McKenzie, D. (2022). Improving Management with Individual and Group-Based Consulting: Results from a Randomized Experiment in Colombia. Review of Economic Studies, 89(1), 346–371. 10.1093/restud/rdab005
- Giorcelli, M. (2019). The Long-Term Effects of Management and Technology Transfers. American Economic Review, 109(1), 121–152. 10.1257/aer.20170619
- Brynjolfsson, E., Rock, D., & Syverson, C. (2021). The Productivity J-Curve: How Intangibles Complement General Purpose Technologies. American Economic Journal: Macroeconomics, 13(1), 333–372. 10.1257/mac.20180386
- Brynjolfsson, E., Li, D., & Raymond, L. (2025). Generative AI at Work. The Quarterly Journal of Economics, 140(2), 889–942. 10.1093/qje/qjae044
- Dillon, E. W., Jaffe, S., Immorlica, N., & Stanton, C. T. (2025). Shifting Work Patterns with Generative AI (Techreport No. 33795). National Bureau of Economic Research. 10.3386/w33795