Week 7. Teams, Peer Effects, Communication, and Coordination
Learning Objectives
By the end of this week, students should be able to distinguish production complementarities, social pressure, peer learning, common shocks and endogenous team formation; define a team using tasks and actual interactions rather than only a reporting line; interpret the costs as well as benefits of communication; and design an evaluation with explicit assignment and exposure units. The research deliverable is a spillover-aware design and exposure map specifying the actual treatment unit, two competing mechanisms, independent quality and worker-welfare measures, and the population to which the claim applies.
Opening Orientation
Central question: When does working together produce complementarities, learning, congestion, pressure, or free riding?
Putting good workers together is not the same intervention as giving existing workers better information, changing their incentives, or helping them coordinate. A team can produce more because its members specialize, because one member helps another, because workers respond to being observed, or because the organization assigns the team easier tasks. A worker can produce less individually precisely because she is helping the team. These possibilities make lateral relationships an economic object rather than an unexplained part of a firm effect.
The organizing question is: when people work together, what creates the gain, who incurs the cost, and what comparison distinguishes the mechanism? We use rosters, workflow dependencies, communication records and separate individual/team outcomes to discipline the answer. Neither a dense communication graph nor a high team average is automatically evidence of efficient cooperation.
Core Points
Bridge
Consider a worker who pauses her own task to help a colleague solve a difficult problem. Her recorded output falls, her colleague finishes sooner, and their project may improve. The same observed pattern could arise if the colleague received an easier task. Begin with who was assigned to work together, when help was possible, what changed, and whose output and time were counted. A credible team evaluation follows the helper, recipient, and shared deliverable.
Week 3 developed measurement and employer learning, Week 4 rewards, Week 5 vertical authority, and Week 6 career development. Week 7 studies lateral production and coordination. We recap only the parts of incentives and learning needed to understand joint work; we do not repeat their full models. Hybrid communication and AI enter as interventions on interaction, not as a second technology-adoption survey. Week 8 will address wage-setting and worker voice, and Week 9 broader work redesign. The approved course outline places the practical endpoint here on treatment units and spillover-aware exposure maps.
Field Core
1. Define the team before estimating a team effect
Build four linked ledgers. A membership ledger records worker, task role, project/team, location and exact overlap intervals. A workflow ledger records task identifiers, inputs, handoffs, dependencies, completion and rework. An interaction ledger distinguishes scheduled access, actual requests, messages, meetings, help and feedback. An outcome ledger distinguishes individual output from unique joint deliverables, quality, customer value and worker experiences.
A supervisor identifier is a useful administrative boundary, not proof of interaction. Two workers can share a manager without collaborating; collaborators can sit in different units. Preserve planned assignment and realized attendance separately. Illness, turnover or treatment-induced attendance changes can make the realized roster endogenous. A worker-hour panel and a team-project panel answer different questions and need an explicit crosswalk.
Use a directed convention throughout: means that worker can affect worker at time . Rows receive influence and columns supply it. Do not quietly transpose this convention when moving from messages to exposure. Observation also has a direction: being able to watch a colleague differs from being watched by that colleague.
A pre-specified overlap-weighted peer-quality measure can be written as
Measure independently of the focal outcome period. If the denominator is zero, record that the worker has no eligible peers; do not silently treat an undefined mean as zero-quality peers. The denominator itself can change under an intervention and should be reported.
Original exposure example. A worker overlaps for ten minutes with a colleague whose pre-period score is eight and twenty minutes with one whose score is two. Duration-weighted exposure is four; an unweighted average across the two names is five. Neither weighting rule is universally right. They correspond to different accounts of when influence is possible.
A team-level product must be counted once. Copying one project score onto four member records creates four observations of the same outcome, not four independently produced projects. Report quality per deliverable, total deliverables and labor input separately. A two-person team producing one highly rated proposal is not directly comparable to two individuals producing two proposals without a rule for evaluating the portfolio.
Table 1:Teams: production, exposure, and outcomes
| Object | What must be recorded | Economic interpretation | Implementation rule and principal risk |
|---|---|---|---|
| Planned membership | Assignment date, project, role, eligible pool, location, expected overlap | Who was supposed to work together | Preserve original assignment even after no-shows; realized membership can be a response to treatment. |
| Realized collaboration | Actual overlap, participation, requests, feedback, handoffs | Who could exchange information or affect production | A roster is not an interaction graph; record zero opportunity separately from no use of an available opportunity. |
| Workflow dependency | Task IDs, upstream input, downstream recipient, input quantity/quality, timestamps | Bottlenecks and technical complementarities | Link inputs to unique final products; correlated outcomes can reflect a shared input rather than social influence. |
| Peer quality | Pre-period skill or productivity measures, estimation sample, reliability | Capacity to help, teach, set pace, or execute a complementary task | Do not estimate peer ability using the same focal-period output being explained. Use separate rounds and discuss noisy ranks. |
| Directional visibility | Who can see whom, orientation, actual presence | Being observed versus observing | Define A_ij = source j can affect receiver i; transposition changes the exposure. Mas–Moretti motivate this distinction Mas & Moretti, 2009. |
| Own treatment | Randomized offer/access, receipt, timing | Direct opportunity to use a resource | Record assigned and realized treatment; take-up is not automatically exogenous. |
| Peer treatment | Baseline adjacency, peer assignment, eligible neighbor count, weighting | Indirect access or congestion | Freeze the primary graph before intervention. A fixed recipient count mechanically links own treatment and peer exposure. |
| Social ties | Friendship/support nominations and nomination limits | Norms, altruism, social comparison, information | Do not equate friendship with random peer quality; the Bandiera design uses a specific workplace and incentive environment Bandiera et al., 2010. |
| Communication cost | Sender/recipient time, abandoned work, waiting, rework, interruptions | Resources spent producing information | A recipient’s gain is not the combined gain. Track displaced work and delayed benefits Battiston et al., 2021. |
| Joint output | One identifier per deliverable, rubric, blind quality assessment, completion | Value produced collectively | Count once; copied team scores on member rows are not independent output observations. |
| Individual output | Task difficulty, hours, interruptions, assisting time | Direct production versus helping | Lower individual output can accompany higher team value. Do not use own output alone to penalize helpers. |
| Worker welfare | Workload, stress/pressure, support, learning, schedule feasibility, credit | Distribution of costs and benefits | Satisfaction is one endpoint, not a complete monetary welfare measure; record eligibility and response rates. |
Minimal ledger: assignment → opportunity → interaction → task → unique output, with separate quality and worker outcomes. The learner must be able to explain every arrow rather than merely merge records by date and supervisor.
2. Complementarity, free riding and coordination: three different models
2.1 Production technology and assignment
An original organizing model writes net team production as
indexes teams, and workers, the role assigned to worker , and effort. is worker-role productivity, a technological interaction, communication, the dependency structure and a common shock. Positive cross-partials are production complementarities, not an identification strategy. Common demand shocks can generate correlated output without . A well-fitting decomposition does not establish that its components are separately identified.
Becker–Murphy make coordination costs central to the division of labor. Kremer’s O-ring model supplies a different benchmark: errors in complementary tasks can sharply reduce final value and create incentives for assortative matching. The relevant form of complementarity is a modeling choice, not a synonym for any positive peer correlation Becker & Murphy, 1992Kremer, 1993.
Original comparative-advantage example. Four workers can perform stages 1 and 2 at capacities A=(10,2), B=(2,10), C=(7,7), D=(7,7). Each two-person team assigns one worker to each stage and produces the minimum stage capacity. Pairing A with B and C with D yields 10+7=17 units. Pairing A with C and D with B yields 7+7=14. The same people and person-hours generate different output through role assignment. The example establishes neither a universal benefit of demographic diversity nor a general rule favoring homogeneous teams.
2.2 Joint rewards and social pressure
For a brief free-riding benchmark, let , each of workers receive , and effort cost be . Assume , integer , and nonnegative effort with no binding upper bound. An individual chooses , whereas a planner maximizing output minus all effort costs chooses . With , these are one and four. This is an original linear-quadratic illustration, not a full statement of Holmström’s team-incentive results Holmström, 1982.
Kandel–Lazear explain how mutual monitoring, norms and social pressure can change incentives inside partnerships. That mechanism can increase effort without changing the physical production function. Peer pressure also imposes costs; a production increase alone does not establish improved worker welfare Kandel & Lazear, 1992. Leave complete compensation design to Week 4. Here ask whether effort changes because the coworker changes the payoff to effort, the knowledge available, or the cost of deviating from a norm.
2.3 Communication has an opportunity cost
Let the net benefit of a common communication activity be
Assume , , , and . Then . An interior optimum requires ; otherwise the optimum is the boundary . The logarithm captures diminishing informational returns; the linear and quadratic costs summarize time and congestion. For , the unique interior optimum is , with . More communication beyond that point reduces this specified objective. These are invented units, not an estimated meeting-time recommendation.
Sender–recipient accounting. If helping reduces a sender’s output by five units and raises the recipient’s by eight comparable units, combined output rises by three, not eight. If units differ, apply an explicit value conversion instead of adding them. If help improves future skill or prevents rare defects, current counts miss those benefits. Conversely, a helpful message can interrupt several other people. Record both sides of the exchange before proposing a communication intervention.
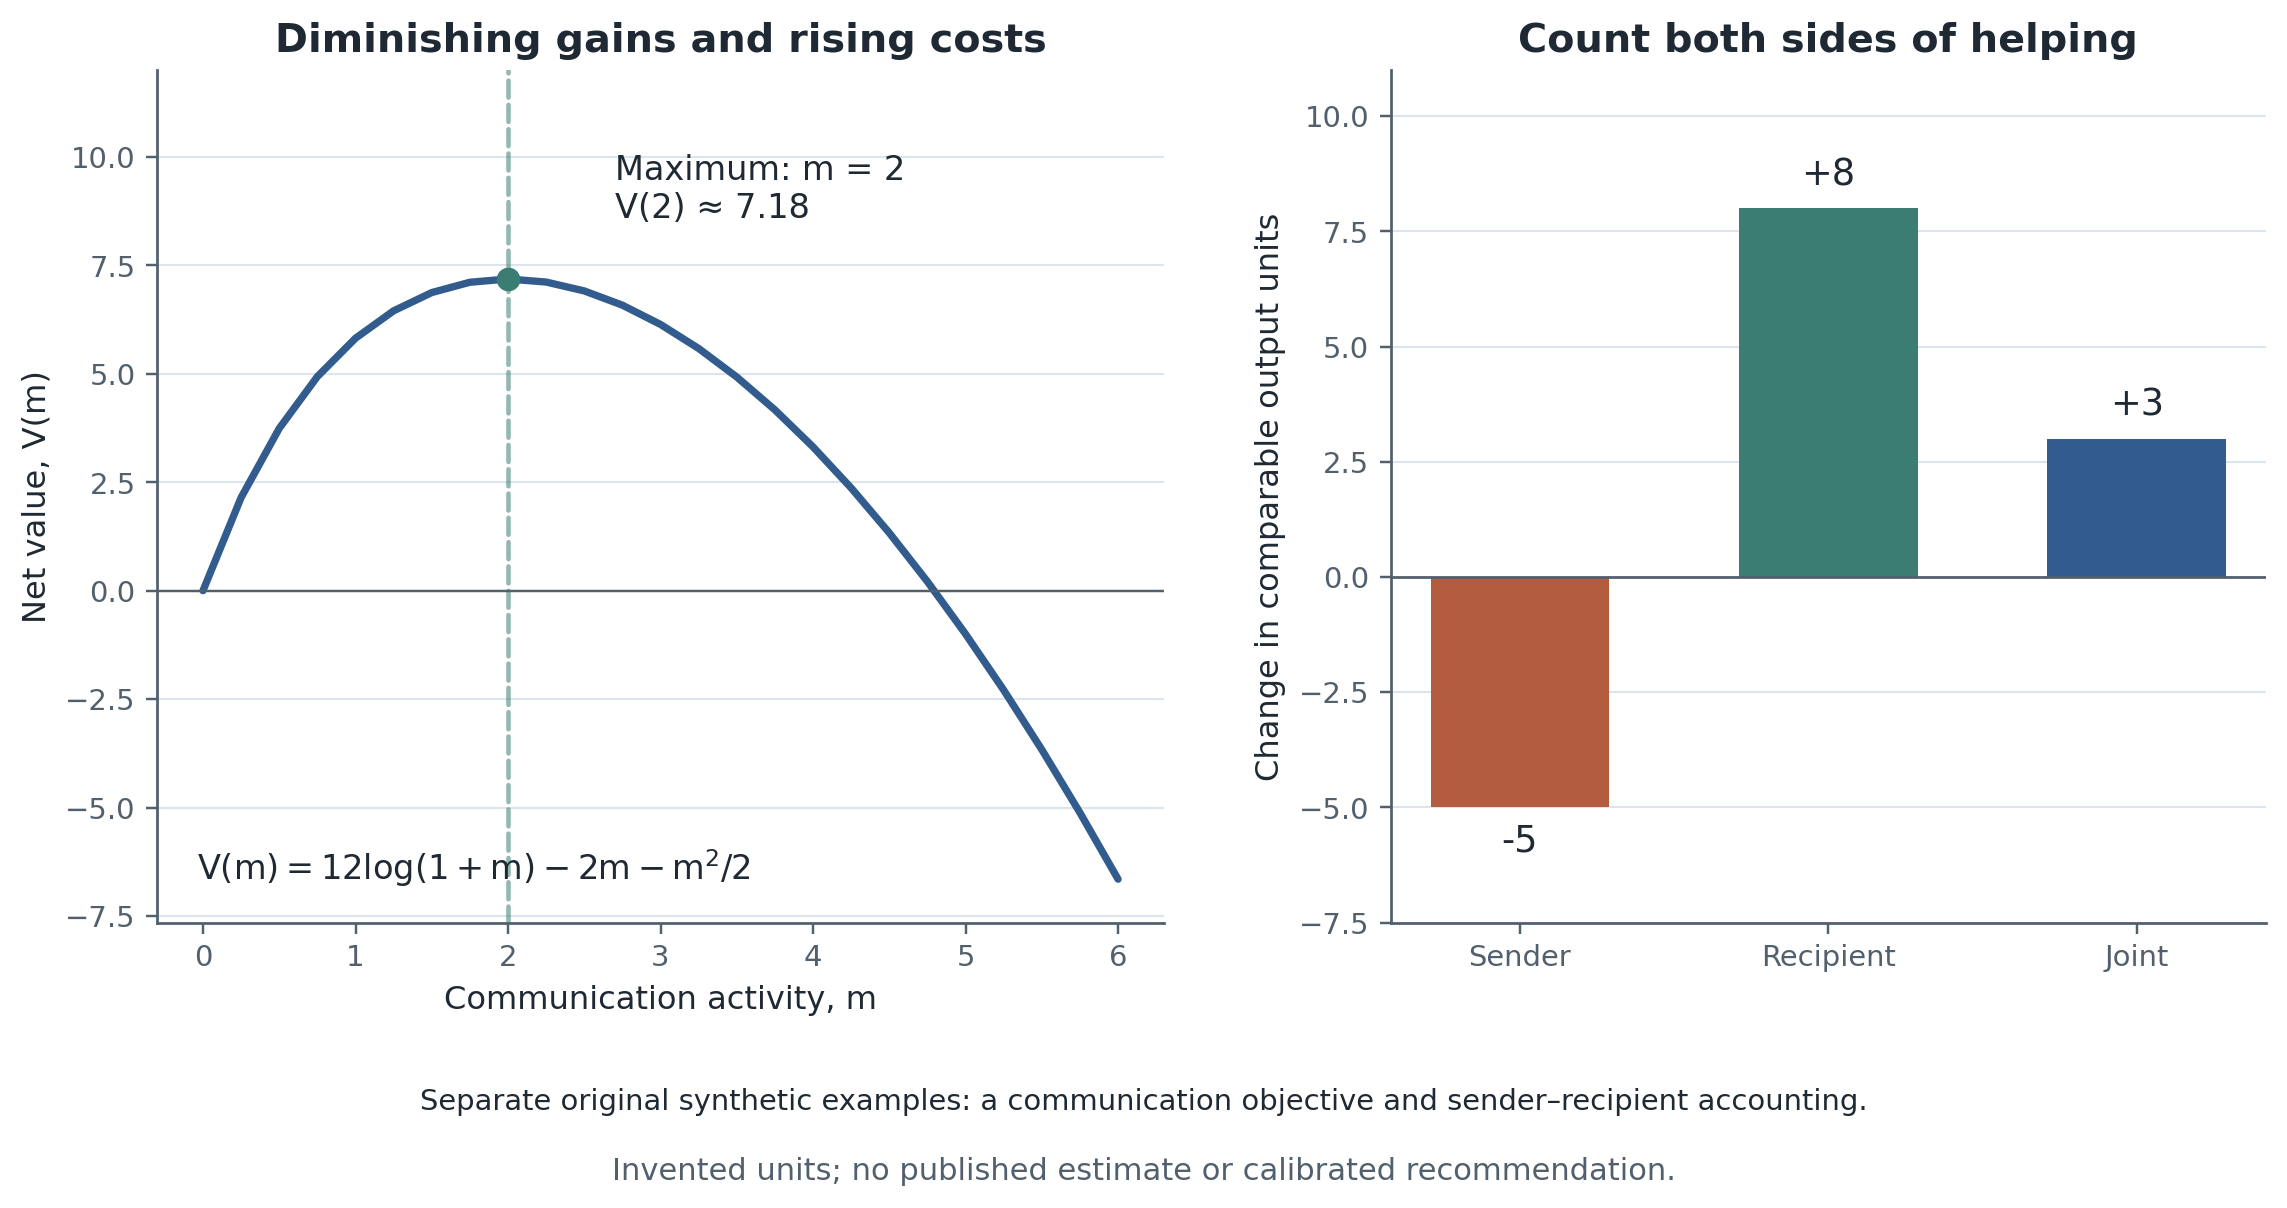
Figure 1:Original synthetic communication illustrations. Left: the specified concave objective reaches its unique maximum at . Right: a separate sender/recipient example adds comparable output changes of -5 and +8 to joint value +3. The two panels are distinct teaching constructions; neither is a calibrated communication recommendation or published estimate. The plot script uses the lab’s saved curve and accounting inputs.
3. Establishing peer responses: observation, ability and friendship
3.1 Mas–Moretti: directional visibility as mechanism evidence
Mas–Moretti combine high-frequency supermarket productivity with variation in the coworkers present during a shift. Their evidence links a worker’s response particularly to productive coworkers who can see that worker, rather than treating all proximity as equivalent. This supports a social-pressure interpretation in their setting Mas & Moretti, 2009.
For design, distinguish the source of variation in staffing from the evidence about the channel. Routine scheduling variation is not a researcher-run peer lottery. Ask whether managers anticipate demand when staffing, whether checker roles or queues change, how permanent peer productivity is estimated, and whether a common demand shock remains. Directional visibility helps discriminate mechanisms; it is not an unrestricted exclusion restriction proving that learning or other channels never operate.
3.2 Experimental co-presence versus naturally occurring social ties
Falk–Ichino compare individual work with work performed in pairs under pay independent of output. Their envelope-filling setting provides a controlled contrast in co-presence, but a short task does not establish long-run gains in every occupation Falk & Ichino, 2006.
Bandiera–Barankay–Rasul link personnel output to friendship information where individual piece rates do not directly reward coworkers’ production. A worker responds differently to more- and less-able friends. This is important evidence against assuming that every observed peer response is a technological production externality Bandiera et al., 2010. Friendship and common work assignments are still measured objects requiring a selection argument; a friendship indicator is not randomized treatment.
Herbst–Mas compare laboratory and field estimates of worker-output peer effects. Their synthesis motivates learning across settings while preserving differences in tasks, incentives and peer definitions; it does not license transporting any single coefficient to every workplace Herbst & Mas, 2015.
4. Team formation: who joins and what they contribute
Hamilton–Nickerson–Owan study a garment plant’s transition from individual to group production and pay. Team adoption, voluntary participation, composition and incentives are intertwined. Their data illuminate selection into teams and heterogeneity in team performance, but the transition is not a clean randomized change of the production technology alone Hamilton et al., 2003.
Weidmann–Deming repeatedly randomize people into teams and use independently measured individual skills to predict team output. Some members systematically improve their teams’ performance beyond those predictions. This is a direct route to studying contributions that individual production tests can miss Weidmann & Deming, 2021.
The empirical lesson is to separate the design-based contribution to a specified team task from a permanent, universal social-skill type. Repeated compositions help distinguish member contributions, but finite-sample rankings remain noisy and may be task-specific. Do not estimate a team-player score using the same outcome that is then used to validate that score. Hold out rounds, tasks or combinations. Persistent pair complementarities can also make an additive individual ranking incomplete.
Deming’s broader labor-market evidence and task-trading model connect social skills to coordination and specialization. It provides motivation and a model bridge, not a randomized estimate of social-skill training inside a firm Deming, 2017.
5. Workflow dependencies, exclusion and the meaning of diversity
Hjort studies flower-production teams with an upstream supplier and two downstream assemblers. Rotation across roles and coworkers makes it possible to examine how the allocation of intermediate inputs varies with team composition. The paper documents discriminatory input allocation and its implications for production in this particular workplace Hjort, 2014.
The methodological contribution for this lecture is the handoff ledger. Final output alone cannot distinguish a downstream worker’s low effort from receiving fewer or worse inputs. Measure who receives which input, who controls the handoff, and whether one worker’s gain displaces another’s. The article’s changes in compensation and environment should not be relabeled as a single researcher-randomized factorial experiment.
Do not translate this setting into a claim that a demographic group is less productive or that diversity is intrinsically harmful. The empirical object is behavior under a specific allocation process and institutional environment. A team’s demographic shares, the positions held by members, functional expertise, language and interaction patterns need not have the same effect. Culture enters as a testable mechanism shaping cooperation, not as an unexplained residual.
6. Communication technology, timing and the cost of helping
6.1 Face-to-face communication and a sequential workflow
Battiston–Blanes i Vidal–Kirchmaier use a setting in which problems pass sequentially between workers and opportunities for face-to-face communication vary for reasons external to the immediate task. They combine a model of information transmission with evidence on recipient processing and sender time Battiston et al., 2021.
The design template is especially useful: identify the communication opportunity, measure both participants and connect the benefit to the difficulty or urgency of the task. Co-location can affect channels besides the measured conversation. An opportunity contrast need not equal the effect of one additional message. To value the intervention, include incoming work the sender cannot process and downstream quality, not only the recipient’s speed.
6.2 Idea generation and idea selection are different endpoints
Brucks–Levav combine laboratory and field experiments comparing virtual and in-person collaboration. Their distinction between generating creative ideas and selecting among them is central: evidence about one phase is not a statement about all stages of innovative work Brucks & Levav, 2022.
Bernstein–Shore–Lazer compare constant, intermittent and absent social influence during a collaborative problem-solving task. The distinction between average solution quality and exploration helps motivate why the timing of interaction can matter separately from the number of contacts Bernstein et al., 2018.
Original summary-statistic example. Candidate solution values of (2,2,10) have lower mean but higher maximum than (6,6,6). A firm needing one breakthrough and a firm deploying every solution can rank these portfolios differently. This arithmetic is not a reproduction of either experiment. Define the evaluation and selection procedure before deciding which communication system is better.
7. Learning, proximity and digital traces
Jarosch–Oberfield–Rossi-Hansberg combine linked employer–employee data with a competitive-market model in which coworkers provide learning opportunities. Their structural interpretation connects wage growth and team composition to knowledge flows. A wage-based association is not direct observation of every transfer of knowledge; the pricing and equilibrium restrictions matter Jarosch et al., 2021.
Cornelissen–Dustmann–Schönberg study peer effects on wages, rather than individual physical output, in a broader labor-market dataset. Use the paper to ask why occupation-level wage responses can differ from task-output spillovers and what additional pay-setting assumptions connect the two Cornelissen et al., 2017.
The published 2026 version of Emanuel–Harrington–Pallais uses office closures and subsequent return-to-office mandates to compare changes in proximity across differently located software teams. It connects feedback, code quality and code quantity, with distinct responses for experienced and less-experienced workers Emanuel et al., 2026.
This is a difference-in-differences design, not randomly assigned office attendance. Its code-quality measures are available for the return-to-office analysis, not symmetrically for both episodes. Use the two interventions as related design checks, not as mechanically interchangeable replications. A helper’s lost production and a colleague’s learning are both outcomes. Keep broader hiring and national extrapolations separate from the within-firm contrasts; the latter do not alone identify aggregate effects of remote work.
Yang and coauthors use electronic communication records around the move to remote work to study collaboration structure. Their article, read with the author correction to the Figure 1 legend (not a retraction), supplies a clear distinction between changes in recorded networks and measured production outcomes. More siloed digital contacts do not by themselves estimate the welfare cost of siloing Yang et al., 2022Yang et al., 2022.
Original capture example. Online interactions rise from ten to thirty while offline interactions fall from thirty to zero. Digital records imply an increase; total interactions fall from forty to thirty. This does not prove such a shift occurred in a cited paper. It shows why changes in recording coverage must be distinguished from changes in communication.
8. A current frontier: can AI substitute for some functions of a teammate?
Dell’Acqua and coauthors’ 2026 published Organization Science article compares individual and paired work with and without generative AI in product-development tasks. The design makes it possible to compare human teaming, AI access and their interaction, rather than comparing two self-selected groups of users. The published version distinguishes generated ideas, evaluative selection and reported emotional experience Dell'Acqua et al., 2026.
A useful teaching estimand on a common outcome scale is
where denotes paired work and AI assignment. This is an additive-scale interaction, not proof of technological substitution under every production function. Check assignment, compliance and the unit at which deliverables are scored. The published implementation notes include incomplete teams and reassignment to individual work; preserve intended assignment separately from realized pairing, and inspect how the analysis handles these cases. A pair consumes different labor input from an individual, and a short product-development exercise is not an estimate of long-run staffing or economy-wide displacement. “No significant difference” is not automatically statistical equivalence.
The paper’s publication record matters: use the final title and 2026 version. The published study reports 791 randomized workshop completers and 776 complete post-task surveys. These are different denominators. Do not mix the earlier working-paper participant count with the published sample. This is a focused teamwork application; Week 9 will take up organization-wide implementation.
9. From data opportunities to researchable questions
Hoffman–Stanton’s personnel-economics review is a useful guide to interpreting individual-firm studies and to explaining which mechanisms may travel Hoffman & Stanton, 2025. For this week, four proposed project directions are especially concrete:
Access rather than forced participation. Randomize access to a help channel or protected collaboration time. Record offers, use, sender time and outcomes of eligible nonusers. Take-up is a response; it is not the treatment assignment.
Synchronized versus unsynchronized schedules. Compare schedules with equal total in-person days but different teammate overlap. This can distinguish attendance volume from coordination, provided schedule constraints, compliance and affected outsiders are observed.
Team composition and task design. Rotate comparable workers across projects whose skills are complementary or substitutable. Measure pre-assignment skills and independent quality. Randomizing the roster does not separately randomize every realized communication mechanism.
Human–AI spillovers. Vary access within and across existing teams, measuring untreated coworkers, shared outputs and help effort. A complete evaluation needs a defined saturation policy and exposure support; a treated-worker contrast can miss the point.
These are proposed designs, not claims that the questions have never been studied. Start with accessible data: experiment supplements, published data statements and occupational context resources. O*NET describes occupational requirements, not actual interpersonal networks National Center for O*NET Development, n.d.. Digital traces and personnel records may be restricted. A public code listing is not permission to release employees’ messages, identities or proprietary work.
These are selected qualitative design lessons, not a claim that every manuscript, appendix, or microdata file has been replicated. Publication-version checks and access limitations are in sources/07-reference-verification.json after integration.
Table 2:Papers as design templates
| Paper | Data/variation | What the comparison addresses | Implementation lesson | What not to conclude |
|---|---|---|---|---|
| Mas–Moretti (2009) Mas & Moretti, 2009 | High-frequency supermarket output, changing shifts, observation geometry | Output responses to coworkers’ productivity; mechanism evidence from who sees whom | Recover exact overlap and directional visibility, pre-period peer productivity, and scheduling rules | Every positive coworker correlation is a causal technological complementarity. |
| Falk–Ichino (2006) Falk & Ichino, 2006 | Fixed-pay envelope-stuffing experiment, working alone versus alongside a peer | Peer-presence effects without direct team production or shared piece rates | Keep compensation, task and observation environment explicit | The experiment separately identifies every social motive or generalizes automatically to complex projects. |
| Hamilton–Nickerson–Owan (2003) Hamilton et al., 2003 | Garment plant transitioning from individual to group production/pay | Team adoption, participation and productivity in a joint organizational change | Track joining order, individual histories, composition and task assignment | The observed transition isolates teamwork technology independently of selection and pay. |
| Bandiera–Barankay–Rasul (2010) Bandiera et al., 2010 | Personnel output and friendship data under individual piece rates | Social incentives and productivity responses to friends | Preserve the distinction between ability, friendship and same-shift presence | Friendship assignments are random, or the result is a generic team-bonus effect. |
| Weidmann–Deming (2021) Weidmann & Deming, 2021 | Independent individual tests and repeated randomized team compositions | Member contributions beyond predicted team skill | Connected repeated assignments; evaluate ranks on held-out rounds; separate team output and member attribution | A single team’s residual identifies each member’s causal social skill. |
| Hjort (2014) Hjort, 2014 | Upstream/downstream production links and rotating teams in a flower plant | How input allocation and relationships affect production | Follow inputs through the actual workflow; distinguish roster variation from other changes | A universal productivity ranking of demographic compositions, or randomized factorial variation in every mechanism. |
| Battiston–Blanes i Vidal–Kirchmaier (2021) Battiston et al., 2021 | Sequential problem processing and exogenous opportunities for face-to-face exchange | Recipient processing and sender opportunity costs | Measure both sides, queue conditions and the work displaced by helping | More communication is always better or a recipient gain is the aggregate effect. |
| Brucks–Levav (2022) Brucks & Levav, 2022 | Laboratory and field communication-format experiments | Idea generation versus idea selection | Specify whether value comes from all ideas or the selected one; keep labor input comparable | Virtual communication necessarily harms every kind of task or selection. |
| Bernstein–Shore–Lazer (2018) Bernstein et al., 2018 | Controlled collective problem-solving with constant/intermittent/no interaction | Exploration and convergence under different information rhythms | Analyze mean, best solution and variance as different performance objects | A general workplace prescription for meeting frequency. |
| Jarosch–Oberfield–Rossi-Hansberg (2021) Jarosch et al., 2021 | Matched data and a competitive equilibrium model of learning | Knowledge transfer and its pricing under structural restrictions | Separate moments, equilibrium interpretation and counterfactuals | Wages directly measure every unit of coworker teaching. |
| Cornelissen–Dustmann–Schönberg (2017) Cornelissen et al., 2017 | Matched labor data with estimated peer productivity and wage outcomes | Peer-related wage responses in broader occupations | Keep wage and physical-output estimands separate; inspect sorting controls | A wage coefficient is the same parameter as scanner-output spillovers. |
| Yang et al. (2022, corrected) Yang et al., 2022Yang et al., 2022 | Electronic communication around a company-wide move to remote work | Changes in collaboration network structure | Track recording coverage and use the corrected Figure 1 legend | More digital contact means more total communication, or siloing directly measures output/welfare. |
| Emanuel–Harrington–Pallais (2026) Emanuel et al., 2026 | Differing proximity changes around closures and return-to-office mandates | Feedback, code quantity and quality under DiD assumptions | Quality is measured for the RTO design, not around the initial closures; examine worker experience and helper costs | Randomized attendance, identical measurement in both episodes, or automatic aggregate-policy extrapolation. |
| Dell’Acqua et al. (2026) Dell'Acqua et al., 2026 | Factorial individual/pair × AI field assignment in product development | Teaming, AI access, and their interaction on assessed outputs | Separate intended/realized grouping, unique deliverables, person-hours, and survey completeness | Non-significance proves equivalence; a short task estimates long-run headcount effects. |
Discussion rule: for every claimed mechanism, identify one competing explanation and one extra observation or intervention needed to separate it.
Table 3:Data and measurement opportunities
| Source | Useful fields or objects | Design it can support | Access/reproducibility limitation |
|---|---|---|---|
| Roster and scheduling records | Planned and actual member IDs, roles, shifts, attendance, assignment timestamp, schedule revisions | Peer overlap, composition transitions, synchronized attendance | Scheduling can respond to workload or expected performance; protect individual identities. |
| Task and production systems | Task IDs, upstream/downstream links, difficulty, start/end, rework, accepted output | Complementarity, bottlenecks, handoff quality and unique team output | A closed ticket can represent completion, reassignment or abandonment. Audit status definitions. |
| Version control and review | Author/reviewer, request time, comments, code changes, independent quality, outages | Knowledge exchange, helper costs and learning | Code quantity is not software value; later deletions and bugs have distinct interpretations. |
| Calendars, messages and meetings | Invitations, actual participation, duration, direction and channel | Information opportunities, interruptions and collaboration patterns | Content is sensitive; metadata miss informal/offline exchange. Avoid covert collection and unapproved transfers. |
| Surveys and nominations | Pre-treatment skills, friendship/support ties, feedback, workload, stress, credit | Social ties, perceived pressure, differential costs | Nomination caps and selective response can reshape the measured network. |
| Experiment assignment logs | Eligible pool, blocks, saturation assignment, treatment offers, noncompliance | Direct/spillover contrasts, exact randomization reference | Preserve the actual lottery; a generic individual shuffle may generate impossible assignments. |
| Team Players publisher supplement Weidmann & Deming, 2021 | Listed online appendix and Data and Programs ZIP | Original repeated-team research route after local inspection | Listing verified; archive bytes, license, dependencies and exact reproduced target must still be checked. No original execution in this pack. |
| Proximity Harvard Dataverse pointer Emanuel et al., 2026 | Article-linked replication deposit | Original proximity/feedback design after local inspection | DOI identified in the published data statement. Do not assume all confidential raw personnel records are released. |
| Brucks–Levav ResearchBox Brucks & Levav, 2022 | Experimental materials and available research data | Communication format and idea evaluation | Raw media and raw field data have confidentiality limits. Published field summaries are not a worker-level panel. |
| O*NET database National Center for O*NET Development, n.d. | Versioned Work Context and Work Activities descriptors | Motivate task interdependence and choose occupations for a proposed study | Occupation descriptors are not observed individual coworkers or causal peer exposures. |
| Original offline starter | Invented baseline network, assignment, observed outcomes, separate instructor truth | Guaranteed reproducible design-learning path | No real firm, worker or estimated paper coefficient is represented. |
Minimum data request
Ask for assignment rules and the eligible population, not only the final team roster. Obtain task identifiers so a joint outcome can be counted once. Request separate observation and production timestamps, scheduled versus realized overlap, and pre-period peer measures. Pre-specify at least one independent quality measure and one worker-cost measure. Resolve confidentiality and release rules before collecting communication content.
Research Lab
Primary design anchors and reproduction boundary
Mas–Moretti anchor directional peer exposure, Weidmann–Deming anchor repeated team composition, and Battiston et al. anchor communication opportunity costs. The guaranteed code lab is an original synthetic two-stage saturation experiment, motivated by these questions and by the methods in Baird et al. and Aronow–Samii. It is not a replication of any paper’s experimental protocol or empirical estimates Baird et al., 2018Aronow & Samii, 2017.
The Team Players article lists data and programs. The proximity article identifies a Harvard Dataverse deposit; Brucks–Levav explain which experimental files are released and which are confidential. These are optional original-replication entry points, subject to checking the actual files, license and environment. No original microdata or original estimation code has been executed for this pack Weidmann & Deming, 2021Emanuel et al., 2026Brucks & Levav, 2022.
Reproduce
Sixteen invented workers belong to four fixed teams of four. Two teams are randomly assigned high saturation, with three workers receiving a private task aid; the other two have one recipient. The worker lottery within each team is also random. Enumerate all 1,536 permitted allocations, construct own and peer exposures, and estimate exposure-state means using their known assignment probabilities. Separately compare the high- and low-saturation policy.
Diagnose
Explain why recipient-versus-nonrecipient comparisons within a team mix own treatment and changed peer exposure when recipient counts are fixed. Verify that this design has no treated and untreated observations at the same exact peer count. Enumerate a global sharp-null reference distribution holding observed outcomes fixed, and keep it separate from instructor-only calculations that recompute potential outcomes under alternative assignments. Diagnose reflection, exposure timing, sender costs, duplicated joint output and digital-capture changes.
Transfer
Submit two pages plus an exposure diagram. Name the organizational unit, membership and interaction boundaries, intervention, assignment unit, direct and spillover estimands, support, compliance, two competing mechanisms, quality and welfare endpoints, inference plan and one claim not supported. Candidate settings include lateral help channels, code-review access, synchronized schedules, team composition or information-routing rules. Do not make the proposal a generic request for more communication data.
Methods Box
A. Peer correlations do not identify a production externality
A linear-in-means regression can be written as
Contemporaneous peer output responds to own behavior, task demand and common resources. Manski’s reflection problem is not eliminated by excluding one’s own observation from the average Manski, 1993. Original algebra check: in a complete group of four, demeaned leave-one-out peer output equals minus one-third of demeaned own output. For nonconstant outcomes, a within-group regression can mechanically produce a coefficient of minus three with no substantive information about peer effects; with constant outcomes its slope is undefined.
Practical response: use genuinely pre-period peer attributes; document assignment and role transitions; test demand-driven scheduling explanations; and use randomized or plausibly exogenous peer assignment when available. Topology-based instruments need their own exclusion argument. Do not import “friends of friends” as instruments merely because the graph contains them. Predetermined exposure helps timing but does not make endogenous group formation disappear.
B. Interference requires both an assignment rule and an exposure rule
Under a fixed pre-intervention network , define
This is a restriction: assignments producing the same exposure must have the same relevant effect on . A treated manager, a trained expert, three inexperienced peers and three experienced peers need not be equivalent. If identity matters, a treated share may be inadequate. If the intervention changes the network, estimate that change as an outcome and be explicit about a fixed-graph estimand versus a broader policy effect.
For estimation, define the complete exposure state , including own treatment, rather than treating peer exposure alone as sufficient. For discrete complete states , let . On a target population with positive probability of all compared states, an exposure mean has the Horvitz–Thompson form
Enumerate or simulate the actual design to calculate probabilities. A large dataset cannot recover a contrast with zero exposure probability. Exposure-weighted estimates do not fix a wrong exposure mapping. Variance estimation also needs joint exposure probabilities or defensible dependence conditions Aronow & Samii, 2017.
C. Fixed-count saturation has a subtle interpretation
In the lab, let , with , recipients per four-person team. Peer treatment share is . The four states are
| State | Own treatment | Peer share | Unconditional assignment probability |
|---|---|---|---|
| 1 | 0 | 1/8 | |
| 0 | 1/3 | 3/8 | |
| 1 | 2/3 | 3/8 | |
| 0 | 1 | 1/8 |
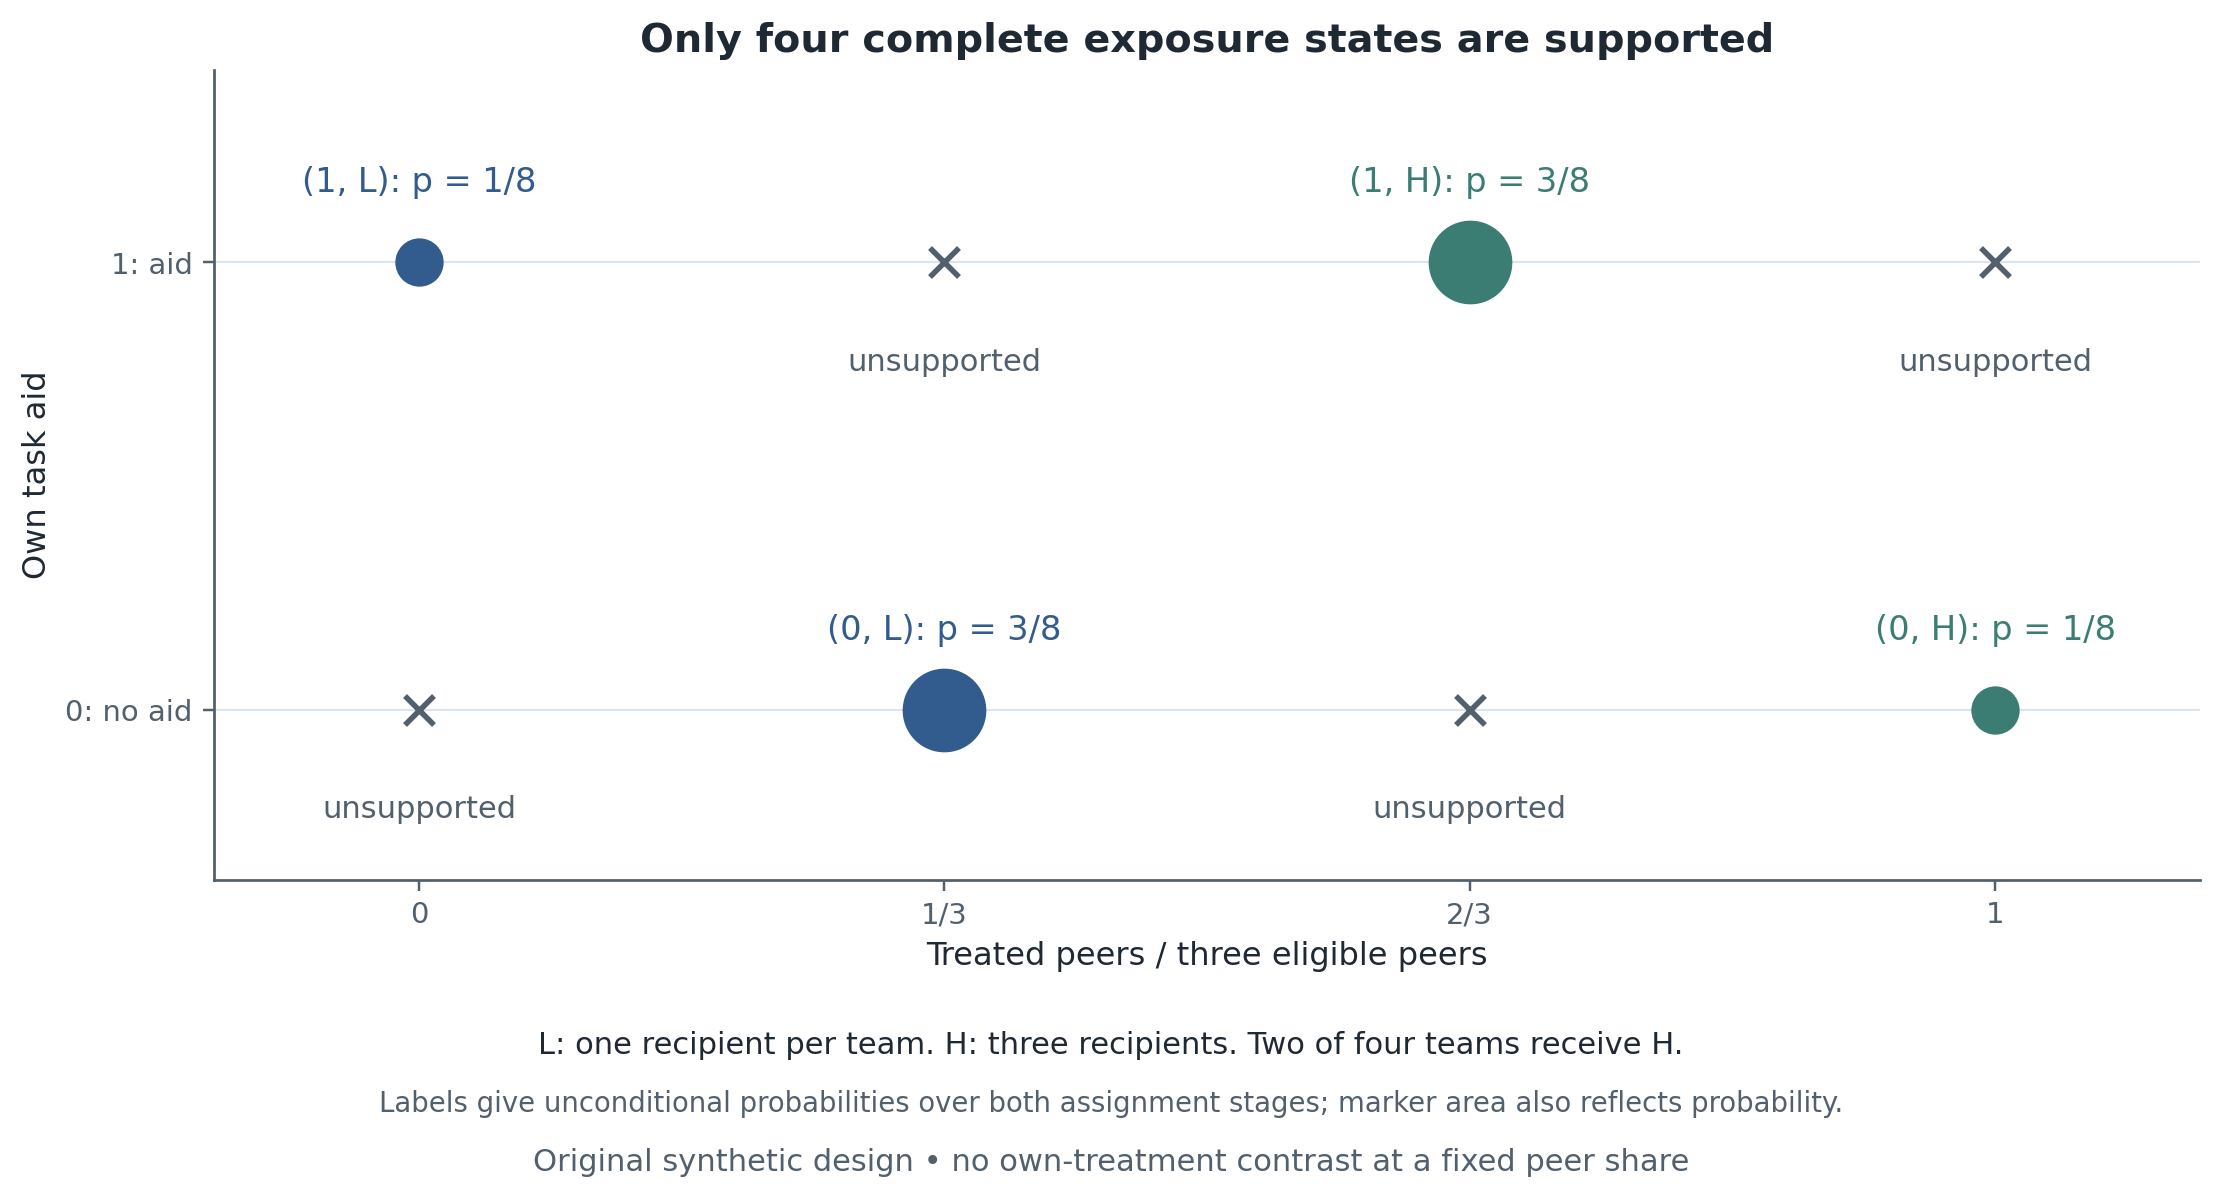
Figure 2:Original synthetic exposure-support illustration. Four fixed teams of four receive one or three task aids, with exactly two high-saturation teams. Each worker has four supported complete states; gray crosses mark unsupported own/peer combinations. Displayed probabilities are unconditional over both stages of the 1,536-allocation lottery. There is no own-treatment comparison holding peer share fixed. The plot script reads the lab’s saved support CSV; these are design probabilities, not empirical estimates from a paper.
There is no fixed peer-share value at which both own-treatment states occur. Thus the within-saturation contrast is not automatically an own-treatment effect holding peers fixed. Under the additional, explicitly synthetic response model , its finite-population expectation is . A zero or small contrast can coexist with beneficial own treatment and beneficial peer exposure.
A design-specific cancellation. In this symmetric mixture of one- and three-recipient teams, for every worker. The unconditional recipient-versus-nonrecipient contrast therefore has expectation under this linear DGP. It does not generally share the within-saturation mixture . This special cancellation does not create fixed-peer support or justify a universal claim about pooled comparisons under other designs or nonlinear responses.
A high-versus-low comparison among untreated workers targets different peer-exposure states at own treatment zero. The full high-versus-low saturation policy instead averages over different own-treatment probabilities:
Neither is the same as treating everyone rather than nobody. Alternative Bernoulli or richer saturation designs may create useful support, with different power and implementation costs. Baird et al. provide the design framework; this finite-count example is our own construction Baird et al., 2018.
D. Match inference to assignment and dependence
Worker-period rows, collaboration dyads and unique team deliverables do not supply the same number of independent observations. In a stable team-level intervention, team-aware inference is a starting point, not a guarantee: workers rotating across teams or cross-team help can connect nominal clusters. Clustering at the individual level alone does not capture team shocks. Conversely, automatically clustering at the largest available unit can leave too few groups for a useful conventional approximation Cameron & Miller, 2015.
For dyadic outcomes, errors may correlate whenever pairs share a member, including across sender and recipient roles. Use a dyadic procedure whose dependence assumptions fit the data, not two mechanically chosen cluster labels. Dyadic standard errors address uncertainty, not endogenous links or reflection Aronow et al., 2015.
In the toy lab, exact assignment enumeration tests the global sharp null that no assignment changes any worker’s outcome. It is not an exact weak-null confidence interval, nor a test of zero spillover alone while allowing unrestricted direct effects. There are 1,536 allocations but only six high-saturation team selections; repeating within-team allocations does not create 1,536 independent teams. Report that discreteness rather than presenting small-sample precision theatrically.
E. Validate outcomes and time costs independently
Record task difficulty, inputs, backlog, rework, accepted quality and unique completions. Estimate the policy effect on these outcomes before conditioning on post-treatment messages or help. Controlling for realized communication can remove the mechanism or introduce selection. A mediation claim needs more structure or additional randomization, such as separately varying opportunities to send and receive help.
Measure learning after separation or on common tasks, while recognizing that persistent task assignment can also generate persistent performance. Help received and help supplied should both be recorded. A project-quality gain cannot establish the effect on total production without labor-time and portfolio accounting. Keep subjective support, pressure, exhaustion and fairness of credit visible without treating any single survey item as total welfare.
F. Minimal reporting panel
Report baseline and realized membership; planned and actual overlap; assignment counts; exposure support and probabilities; treatment take-up; unique deliverables and person-time; individual and team outcomes; independent quality; helper costs; attrition and missing interactions; inference unit; and one plausible alternative mechanism. Show sensitivity to pre-specified network definitions and weighting rules, not an unrestricted search for a favorable peer coefficient.
Table 4:Methods and identification checklist
| Problem | Concrete comparison or method | Required implementation | Limitation that remains |
|---|---|---|---|
| Endogenous teams | Random roster assignment, or a justified rotation comparison | Eligible pool, randomization/rotation rule, baseline measures, planned and realized rosters | Assignment identifies composition effects, not every mediator. Check noncompliance and attrition. |
| Common shocks | Task/time controls, comparable workflow positions, randomized exposure | Match exposure window to task demand; retain workload and task difficulty | More fixed effects do not make demand-responsive scheduling exogenous. |
| Reflection | Independent pre-period peer attributes or experimental peer treatment | No own observation in the peer measure; no contemporaneous outcome-based construction | Leaving own output out does not remove simultaneity or correlated effects Manski, 1993. |
| Attribution of member contributions | Repeated randomized, connected compositions | Independent skill baseline and held-out rounds; quantify rank reliability | One fixed pair identifies its sum, not separate member effects. Noisy ranks invite selection bias Weidmann & Deming, 2021. |
| Direct versus spillover effects | Two-stage saturation and exposure-state estimators | Freeze graph and mapping; calculate inclusion probabilities; display support | Fixed recipient counts link own treatment to peer exposure; a within-saturation contrast is generally mixed Baird et al., 2018Aronow & Samii, 2017. |
| Unsupported exposure contrasts | Support table, design modification, or explicit model restriction | Show probabilities for each required state and relevant joint events | No estimator fixes a zero-probability state without additional assumptions. |
| Policy effect versus mechanism | High/low assignment contrast versus mediator analysis | Report the assigned-policy effect first; separately record helping and communication | Conditioning on realized helping can introduce post-treatment selection. |
| Variance under shared assignment | Design-aware cluster methods or exact assignment enumeration | State treatment unit, number of units and permitted allocations | Four teams remain four teams, even if 1,536 allocations or thousands of messages are observed Cameron & Miller, 2015. |
| Dyadic outcomes | Dyadic dependence adjustment when shared-node dependence is appropriate | Preserve source/receiver identities, shared-node covariance structure and panel timing | Dyadic SEs do not identify causal links or cover arbitrary longer-range network dependence Aronow et al., 2015. |
| Exact randomization test | Enumerate the actual lottery under a sharp null | Hold all observed outcomes fixed; recompute the chosen statistic only | An unrestricted global sharp-null test is not a test of zero spillovers allowing arbitrary direct effects. |
| Team output duplicated on worker rows | Aggregate/deduplicate by product/project ID | Report unique outputs, total labor input and team composition | Statistical clustering alone does not correct a wrongly counted production total. |
| Communication opportunity costs | Paired sender/recipient ledger | Comparable output values, displaced tasks and delayed gains | Recipient benefit is not total benefit; outputs may need explicit value weights Battiston et al., 2021. |
| Recorded versus total interaction | Coverage audit and alternate channels | Trace data collection changes and validation subsets | Stable software does not guarantee stable offline capture Yang et al., 2022. |
| Quasi-experimental proximity | Appropriate DiD comparison and episode-specific outcomes | Show pretrends, composition, co-location changes and measurement windows | Closures and RTOs can have other effects; matching outcome definitions across episodes is essential Emanuel et al., 2026. |
| Human–AI teamwork | Factorial assignment and additive interaction | Show four cells, intended/realized units, unique outputs, person-hours and quality | One-day task performance does not identify sustained replacement or general-equilibrium employment effects Dell'Acqua et al., 2026. |
| Worker welfare | Independent burden and benefit endpoints | Workload, support, stress, credit, learning, response/missingness by assignment | Neither firm output nor satisfaction alone establishes complete welfare. |
Reading Ladder And References
Three required readings: Mas–Moretti (peer productivity and directional observation), Weidmann–Deming (contributions under repeated team assignment), and Battiston–Blanes i Vidal–Kirchmaier (communication benefits and sender costs) Mas & Moretti, 2009Weidmann & Deming, 2021Battiston et al., 2021.
Framework excerpts: Becker–Murphy on coordination; Holmström and Kandel–Lazear on team incentives and pressure; Kremer on production complementarities; Deming and Hoffman–Stanton on the labor perspective Becker & Murphy, 1992Holmström, 1982Kandel & Lazear, 1992Kremer, 1993Deming, 2017Hoffman & Stanton, 2025.
Rotating empirical presentations: Hamilton et al.; Falk–Ichino; Bandiera et al.; Hjort; Cornelissen et al.; Jarosch et al.; Brucks–Levav; Bernstein et al.; Yang et al. Read each for its source of variation, measurement and limitation, not merely its sign Hamilton et al., 2003Falk & Ichino, 2006Bandiera et al., 2010Hjort, 2014Cornelissen et al., 2017Jarosch et al., 2021Brucks & Levav, 2022Bernstein et al., 2018Yang et al., 2022.
Current research: Emanuel et al. (2026) and Dell’Acqua et al. (2026) are published papers, not just the earlier working papers. Herbst–Mas provides a useful cross-setting comparison. Methods follow-up: Manski, Aronow–Samii, Baird et al., Aronow–Samii–Assenova and Cameron–Miller Emanuel et al., 2026Dell'Acqua et al., 2026Herbst & Mas, 2015Manski, 1993Aronow & Samii, 2017Baird et al., 2018Aronow et al., 2015Cameron & Miller, 2015.
Required readings: three, not the entire bibliography
Table 5:Required readings
| Reading | Preparation question | In-class use |
|---|---|---|
| Mas–Moretti (2009) Mas & Moretti, 2009 | What changes when a productive coworker can see you, and what scheduling facts support the comparison? | Draw a directed exposure map; distinguish pressure, learning and shared demand. |
| Weidmann–Deming (2021) Weidmann & Deming, 2021 | Why are independent skill measures and multiple randomized team assignments valuable? | Define member contribution, connectedness, and held-out validation. |
| Battiston–Blanes i Vidal–Kirchmaier (2021) Battiston et al., 2021 | Which worker’s output is counted, and what work is displaced by helping? | Build a sender–recipient accounting table and discuss congestion. |
Rotating presentations and research pathways
Table 6:Rotating presentations and research pathways
| Pathway | Readings | Output |
|---|---|---|
| Technology versus incentives | Becker–Murphy; Kremer; Holmström; Kandel–Lazear; Hamilton et al. Becker & Murphy, 1992Kremer, 1993Holmström, 1982Kandel & Lazear, 1992Hamilton et al., 2003 | A one-page comparison of production, pay and social-pressure mechanisms. |
| Peer response and portability | Falk–Ichino; Bandiera et al.; Herbst–Mas Falk & Ichino, 2006Bandiera et al., 2010Herbst & Mas, 2015 | Explain which margins can plausibly travel from lab tasks to a particular workplace. |
| Workflow and discrimination | Hjort Hjort, 2014 | Trace inputs and outputs rather than treating demographic diversity as the treatment. |
| Coordination and creativity | Brucks–Levav; Bernstein et al. Brucks & Levav, 2022Bernstein et al., 2018 | Define the mean, maximum and selected-output objectives; show why they can disagree. |
| Learning and pay | Jarosch et al.; Cornelissen et al.; Deming Jarosch et al., 2021Cornelissen et al., 2017Deming, 2017 | Separate physical productivity, wage growth and general labor-market evidence. |
| Proximity and new tools | Emanuel et al.; corrected Yang et al.; Dell’Acqua et al. Emanuel et al., 2026Yang et al., 2022Yang et al., 2022Dell'Acqua et al., 2026 | State a focused intervention, its measurement limits, and two remaining counterfactuals. |
| Design and inference | Manski; Aronow–Samii; Baird et al.; Aronow–Samii–Assenova; Cameron–Miller Manski, 1993Aronow & Samii, 2017Baird et al., 2018Aronow et al., 2015Cameron & Miller, 2015 | A support-aware assignment and inference plan, not a list of commands. |
| Field orientation | Hoffman–Stanton Hoffman & Stanton, 2025 | Explain what a within-organization finding adds to personnel economics more broadly. |
Reproduce → Diagnose → Transfer
Reproduce: run the original synthetic two-stage saturation experiment. Reconstruct the directed baseline graph, exposure probabilities, four state means and the high-minus-low saturation policy effect. Exact inference uses the actual 1,536-allocation lottery under a global sharp null.
Diagnose: explain why within-saturation recipient contrasts alter peer exposure, why a complete group’s leave-one-out contemporaneous outcomes generate reflection mechanically, and why sender output and unique team output matter. Instructor truth is separate from observed student data and cannot be used to pretend a real-data standard error is known.
Transfer: two-page proposal plus an exposure map, with assignment unit, supported causal targets, two mechanisms, quality, worker costs, likely cross-team spillovers, and one claim the design cannot establish.
Optional original-data route: Team Players materials, the Proximity deposit and Brucks–Levav ResearchBox are entry points, not executed replications Weidmann & Deming, 2021Emanuel et al., 2026Brucks & Levav, 2022. Verify files, license and target before attempting an original empirical reproduction.
Exercises And Discussion Prompts
Draw three graphs for the same workplace: reporting, workflow and communication. Which one defines your proposed exposure, and why?
Recalculate the overlap example using worker-hours rather than names. What would make the alternative denominator preferable?
Derive the communication optimum and change the cost of including an additional participant. State which costs the model excludes.
Explain why a coworker who improves team output might reduce her own recorded production. Design an outcome panel that can detect this.
In the saturation lab, identify the supported exposure states and a direct-effect contrast that is not supported. What new randomization would help?
Compare the conclusions supported by repeated random team assignment, routine scheduling variation and a remote-work difference-in-differences design.
Explain why an individually randomized AI intervention can affect untreated coworkers. Name the team-level policy estimand you would report.
Write the spillover-aware proposal described above. Include at least one outcome whose interpretation would differ under the two competing mechanisms.
Reproducibility And Code Lab Note
Download the teaching repository (ZIP), or clone the repository. Keep its folder structure and open books/special-topic8-organizational/labs/07-teams-peer-effects-communication-and-coordination/; the lab README supplies the run instructions. Weeks 1–3 use the shared plotting module supplied with the repository.
The Week 7 lab handout and lab README implement original synthetic design reconstruction, with empirical_replication false. All workers, teams, networks, outcomes, and diagnostic numbers are invented. No original microdata or original estimation code were downloaded or executed. Publisher and repository pointers document optional routes whose actual files, permissions, dependencies, and reproduction targets still need inspection.
From the course root, run the lab and regenerate both figures:
ENV_NAME=research bash labs/07-teams-peer-effects-communication-and-coordination/smoke.sh
conda run -n research python assets/scripts/build-week7-teams.py
The standard-library lab preserves all 56 starter assertions. Its smoke compiles Python, compares two fresh default-seed executions with byte-identical manifests, runs seed 88771, and verifies refusal to overwrite a nonempty output directory with exit code 2 and unchanged files. A staging installer preserves authored lab documentation. Tests never require statistical significance. The fixed-outcome global sharp-null distribution is separate from instructor-only recomputed potential outcomes and oracle variance; the latter is not an estimated real-data standard error.
Figure generation uses installed Matplotlib and preserves the exact generated CSV inputs. The transfer memo template requires two pages plus an exposure diagram, actual treatment units, supported targets, two competing mechanisms, independent quality and worker-welfare endpoints, and one unsupported claim. The numerical smoke needs no internet, account, API, GPU, proprietary data, or new package.
Slide Companion Note
The Week 7 slide deck (PDF) and Beamer source develop the four ledgers, directed exposure, production and incentives, repeated composition, workflow, communication costs, learning and proximity, human–AI teaming, design support, inference, and the lab proposal. The five detailed maps remain readable chapter handouts. Original examples retain their assumptions, and each empirical design keeps its setting, variation, target, and limitation visible.
Compile from the course root:
conda run -n research latexmk -cd -pdf -interaction=nonstopmode slides/week7/07-teams-peer-effects-communication-and-coordination.texBridge Forward
Week 7 explains how lateral relationships create production and information spillovers—and why individual performance need not reveal the whole organizational effect. Week 8 asks how internal wage rules, outside opportunities, retention and worker voice divide the gains and costs of employment. Team value is not automatically captured by the worker who creates it; that is the bridge, not a presumption about the answer.
- Mas, A., & Moretti, E. (2009). Peers at Work. American Economic Review, 99(1), 112–145. 10.1257/aer.99.1.112
- Bandiera, O., Barankay, I., & Rasul, I. (2010). Social Incentives in the Workplace. The Review of Economic Studies, 77(2), 417–458. 10.1111/j.1467-937X.2009.00574.x
- Battiston, D., Blanes i Vidal, J., & Kirchmaier, T. (2021). Face-to-Face Communication in Organizations. The Review of Economic Studies, 88(2), 574–609. 10.1093/restud/rdaa060
- Becker, G. S., & Murphy, K. M. (1992). The Division of Labor, Coordination Costs, and Knowledge. The Quarterly Journal of Economics, 107(4), 1137–1160. 10.2307/2118383
- Kremer, M. (1993). The O-Ring Theory of Economic Development. The Quarterly Journal of Economics, 108(3), 551–575. 10.2307/2118400
- Holmström, B. (1982). Moral Hazard in Teams. The Bell Journal of Economics, 13(2), 324–340. 10.2307/3003457
- Kandel, E., & Lazear, E. P. (1992). Peer Pressure and Partnerships. Journal of Political Economy, 100(4), 801–817. 10.1086/261840
- Falk, A., & Ichino, A. (2006). Clean Evidence on Peer Effects. Journal of Labor Economics, 24(1), 39–57. 10.1086/497818
- Herbst, D., & Mas, A. (2015). Peer Effects on Worker Output in the Laboratory Generalize to the Field. Science, 350(6260), 545–549. 10.1126/science.aac9555
- Hamilton, B. H., Nickerson, J. A., & Owan, H. (2003). Team Incentives and Worker Heterogeneity: An Empirical Analysis of the Impact of Teams on Productivity and Participation. Journal of Political Economy, 111(3), 465–497. 10.1086/374182
- Weidmann, B., & Deming, D. J. (2021). Team Players: How Social Skills Improve Team Performance. Econometrica, 89(6), 2637–2657. 10.3982/ECTA18461
- Deming, D. J. (2017). The Growing Importance of Social Skills in the Labor Market. The Quarterly Journal of Economics, 132(4), 1593–1640. 10.1093/qje/qjx022
- Hjort, J. (2014). Ethnic Divisions and Production in Firms. The Quarterly Journal of Economics, 129(4), 1899–1946. 10.1093/qje/qju028
- Brucks, M. S., & Levav, J. (2022). Virtual Communication Curbs Creative Idea Generation. Nature, 605, 108–112. 10.1038/s41586-022-04643-y
- Bernstein, E., Shore, J., & Lazer, D. (2018). How Intermittent Breaks in Interaction Improve Collective Intelligence. Proceedings of the National Academy of Sciences, 115(35), 8734–8739. 10.1073/pnas.1802407115