Week 3. Performance Measurement, Monitoring, and Employer Learning
Learning Objectives
By the end of this week, students should be able to distinguish production from its measurement; explain how repeated signals change employer beliefs; separate learning about a worker from changes in the worker’s productivity; interpret objective measures, subjective ratings, and monitoring records without treating any as ground truth; and design a study that measures both a targeted performance margin and an independently recorded outcome. Students should also be able to identify what a monitoring or feedback intervention actually changes, select an appropriate comparison and inferential unit, and state which welfare and selection questions remain unanswered.
Research deliverable: a two-page measurement-validation plan with two distinct outcome families, a worker-welfare margin, and an information timeline.
Opening Orientation
Central question: How do firms learn about ability, effort, and match quality when observed performance is incomplete or strategically produced?
A firm introduces a dashboard. Recorded idle time falls, supervisor ratings rise, and employee turnover changes. Has the firm learned more about its workers, induced greater effort, reassigned difficult tasks, changed how time is coded, or made the job less tolerable? These are different economic explanations. A larger personnel dataset does not separate them by itself.
This week opens the information problem inside the employment relationship. Week 2 followed people into jobs; Week 3 asks what an employer can infer once work begins. The object is not a universal productivity score. It is the sequence linking production, observation, interpretation, feedback, and organizational decisions. A record can be accurate as an administrative event and still be a poor measure of the economic construct a paper needs.
The contemporary personnel-economics review by Hoffman and Stanton provides the broad research map, while Benson and Shaw explain why evaluation is one managerial function among several. We use these reviews as orientation, not as substitutes for studying concrete designs Hoffman & Stanton, 2025Benson & Shaw, 2025. The three required research readings examine different parts of the problem: Kahn–Lange on learning versus changing productivity; de Janvry and coauthors on strategically produced evaluation signals; and Bernstein–Li on who receives existing performance data. The remaining readings create pathways for student projects rather than an impossible compulsory list.
Core Points
Bridge
Recruitment creates an initial workforce and an initial information set. Probation and early reviews update that information but also affect assignment, dismissal, and who remains visible in the data. Carry Week 2’s selection discipline forward: performance observed only among retained workers is not the same outcome as total contribution by the baseline workforce.
Keep three boundaries clear. We study ratings before deriving optimal compensation contracts; we study evaluator heterogeneity without attempting the full causal-manager-effect lecture; and we distinguish learning about a fixed type from human-capital accumulation without replacing the later training and career-ladders week.
Imagine an employee who completes the same work before and after a new review form, but receives a higher score afterward. The score changed; productive capacity may not have. Now imagine that the form makes one visible task especially salient, and the employee reallocates time toward it. Production may change too, but the score alone cannot show which work was displaced. Finally, a more precise audit could help the employer learn about unchanged performance. These are recording, behavior, and information changes with different implications.
A useful comparison pairs the routine measure with a second outcome that could contradict it: completed work with blinded quality audits, or activity logs with rework and employee-reported pressure. Ask who observes each measure, when they receive it, and what decision it can affect. These questions connect the Bridge intuition to the Field Core models and research designs.
Field Core
1. Begin with the production object, not the dashboard
A useful teaching decomposition, not an estimated production function from a cited paper, is
Indices , , and identify the worker, job/task, and period. Here is quality-adjusted production on a comparable scale, is productive capacity, is worker–job match, is effort, is task difficulty, and collects common operating conditions; is the remaining production disturbance. The additive form is deliberately simple. In many jobs these inputs are complementary, and neither output nor effort has a natural common cardinal scale.
The observed record can follow a different equation:
The version index denotes a sensor, rubric, software, or coding regime; is the sensitivity of the recorded index to production; denotes the evaluator; is evaluator calibration; is strategic reporting or visibility; is residual recording noise; and indicates that the record is observed. A rating scale can additionally discretize this latent index. A move from rating 2 to rating 3 should not automatically be valued like a move from 4 to 5.
This decomposition gives students a practical data request. For a sales measure, request prices, returns, customer mix, territory assignments, and product availability. For a service-time measure, request queues, complexity, quality checks, and rework. For a performance rating, request the rubric version, rater, review date, period covered, and who saw the rating before each pay or assignment decision. For an attendance record, define whether approved leave, training, remote work, or system downtime is coded as absence.
An input such as calls made can be informative without equaling output. Revenue can change through price rather than quantity; time saved can shift into unmeasured support rather than production; customer ratings can reflect customer composition. The correct response is not to reject these records but to state what each measures and add a second outcome family capable of challenging the proposed interpretation.
Use the table as a data dictionary, not a ranking of “good” versus “bad” outcomes. A useful variable has an explicit economic interpretation, denominator, recording rule, and information date.
Table 1:Measures, signals, and organizational decisions
| Recorded object | What it directly measures | Competing explanation for a change | Independent check / necessary fields | Labor decision it may inform |
|---|---|---|---|---|
| Completed units, sales, or services | A recorded quantity, revenue, or case count | Case mix, prices, returns, incomplete tasks, reassignment | Task difficulty, unit prices, defects, rework, customer mix; preserve fixed-cohort and exposure denominators | Task allocation, capacity planning, evaluation |
| Time use or attendance | Classification of time or presence | Recoding, leave rules, nonproduction support, unrecorded work | Stable activity taxonomy, total eligible time, independent output and quality | Scheduling, supervision, discipline |
| Supervisor rating | An evaluator’s judgment under a rubric | Leniency, actual coaching, worker assignment, changed thresholds | Rater and rubric IDs, crossed ratings, independent outcomes, information dates | Pay, retention, advancement |
| Blinded audit or standardized task | Performance on the audited sample/task | Audit selection, atypical test conditions, time mismatch | Known sampling rule, blindness, sampling weights where needed, repeat audits | Validation of routine performance measures |
| Worker self-report | Perceived effort, beliefs, stress, autonomy | Reporting incentives, fear of disclosure, survey attrition | Confidential collection, unchanged questions, take-up and response rates | Feedback design and worker-welfare analysis |
| Wage or promotion | A compensation or allocation decision | Bargaining, pay bands, vacancies, outside options, ability signals | Contract regime, decision date, employer information set, career eligibility | Labor-market reward; not a direct productivity measure |
| Prediction of future performance | A forecast using an information set | Own-record leakage, future data, selective labels, changed jobs | Past-only features for prospective use; independent validation set; outcome coverage | Updating, probation, future assignment |
Two common traps. Standardizing scores within each evaluator can erase real quality differences as well as generosity. Conditioning on post-reform tasks can remove the assignment response that the reform caused. Keep raw measures and report what comparison each normalization targets.
Application anchors: Kahn & Lange, 2014Frederiksen et al., 2020Bernstein & Li, 2026Takahashi et al., 2021.
Worked case-mix example. Suppose two employees each handle ten tasks. One handles eight easy tasks worth one completed unit each and two hard tasks worth two units each; another handles two easy and eight hard tasks. Raw completion counts both equal ten, while difficulty-adjusted contributions are 12 and 18 under the specified hypothetical weights. Those weights require economic justification. Moreover, if the intervention changes assignment, controlling for post-intervention task difficulty can remove part of the policy’s effect. Report the total assignment-inclusive effect and, separately, a clearly defined fixed-case-mix comparison. Neither should be mislabeled as the other.
2. What does it mean for an employer to learn?
Start with a deliberately restrictive signal model. A worker has fixed ability . After accounting for effort and task conditions, the firm observes , with mean-zero normal noise of known variance , independent across periods and independent of the initial type. Let and be the posterior mean and variance after signal , and the gain placed on its surprise. Posterior updating is
The new observation matters more when it is precise relative to the prior. A firm uncertain about a novice can revise its belief sharply; a firm with a long reliable record may put little weight on one surprising evaluation. This is a model of information, not a statement that managers actually compute Gaussian posteriors.
Numerical illustration. With prior mean zero and variance one, a signal of two produces posterior mean 0.4 and variance 0.8 when its noise variance is four. With noise variance one, the same signal produces posterior mean one and variance 0.5. The worker’s productive type has not changed between these examples. Only signal precision has changed.
The assumptions reveal the research agenda. Does the employer know task difficulty? Is effort separately observed? Are successive scores independently noisy or copied from past ratings? Is a new sensor changing precision or changing the activity measured? Do the worker, supervisor, and outside employers see the same information? Calling a variable a signal does not settle these questions.
Repeated ratings improve precision less when raters share errors. For equal-variance raters, common pairwise error correlation , and individual error variance ,
Four independent unit-variance ratings yield variance 0.25. With correlation 0.75 they yield 0.8125. A shared systematic bias is not averaged away at all. These are covariance identities under the stated assumptions, not estimated effects of adopting multirater evaluation.
Ockenfels, Sliwka, and Werner combine a model with controlled laboratory evidence on multirater evaluations and incentives. Use the study to ask when aggregation becomes more informative, not to claim that more reviewers always solve personnel-evaluation problems Ockenfels et al., 2025. The organizational design question is which independent information each additional reviewer brings and what reporting incentives each faces.
3. Employer learning is not the same as rising productivity
The fixed-type model becomes misleading when productive capacity itself changes. A minimal alternative is , where , , independently across periods and independently of initial ability and observation noise. Before a new observation, uncertainty is ; after it,
Now the employer can remain uncertain even after many observations because the target moves. Figure Figure 1 isolates that distinction under the hypothetical signal model. Changing knowledge, health, technology, job assignments, or motivation can all invalidate a fixed-type approximation. A decline in forecast errors can indicate learning; changing performance can indicate productivity evolution; wages combine both with pay rules and outside opportunities.
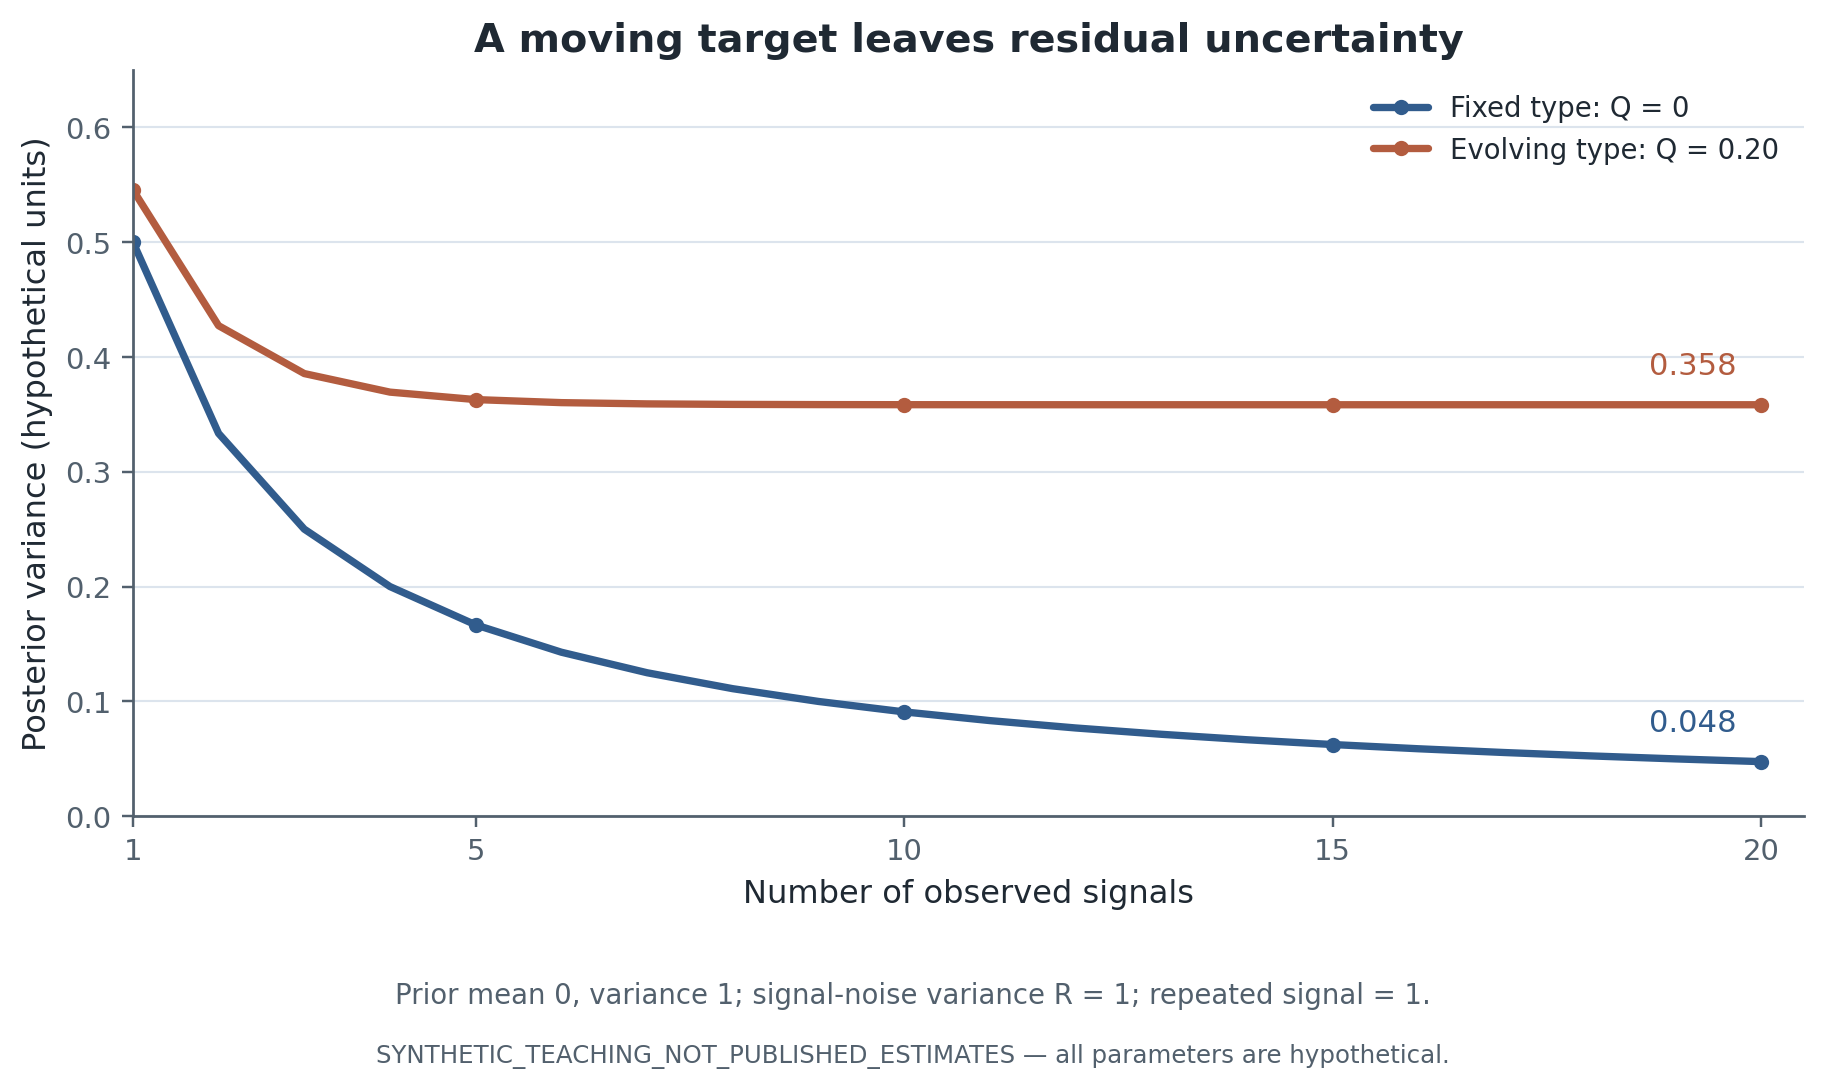
Figure 1:SYNTHETIC_TEACHING_NOT_PUBLISHED_ESTIMATES. Model-implied uncertainty from the lab’s generated CSV: initial mean 0 and variance 1, signal-noise variance 1, repeated signal 1, and process variance 0 or 0.20. Under these assumptions posterior variance does not depend on the realized signal values. The curves do not estimate any firm’s learning speed or worker ability.
The classic employer-learning papers teach how to exploit differences between information observed by researchers and information available to firms. Farber and Gibbons derive restrictions linking wages and researcher-observed ability correlates as experience accumulates. Importantly, their model can imply a schooling coefficient that stays constant with experience. Altonji and Pierret study schooling and difficult-to-observe ability proxies in an employer-learning/statistical-discrimination framework. Their test jointly follows experience interactions with schooling and a harder-to-observe productivity proxy: increasing weight on the proxy accompanies declining weight on schooling in that conditional specification. This is a different conditioning argument from Farber–Gibbons, not a prediction that every learning model has a falling schooling coefficient Farber & Gibbons, 1996Altonji & Pierret, 2001. Lange then uses a model to estimate how rapidly employer uncertainty is resolved; that is not a direct audit of individual managers’ updating rules Lange, 2007.
Required anchor: Kahn and Lange. Their twenty-year single-firm panel combines performance measures and earnings in a dynamic model that allows both employer learning and changing productivity. The additional performance information helps distinguish mechanisms that wage data alone struggle to separate Kahn & Lange, 2014. The useful lesson is the identification architecture: which serial covariances and information restrictions distinguish persistent productivity, changing productivity, and forecast error? Ratings remain noisy measures rather than observed true ability. Students should explain what a different measurement process would do to the decomposition.
A practical project should therefore write an information-availability timeline before estimating a wage regression. Record when work occurred, when a score was entered, when the employer received it, and when pay or assignment was set. A later score can help a researcher assess earlier expectations without having been available to the employer at that time. Using that later score as an actual earlier policy predictor would be leakage. These are different uses of the same column.
4. Objective and subjective measures can complement one another
“Objective” usually means recorded by a rule; it does not mean complete, manipulation-proof, or independent of task allocation. “Subjective” means judgment enters; it does not imply the information is useless. The empirically useful question is whether a rating adds information about relevant performance beyond the existing measured outcomes and whether that information survives changes in evaluator and context.
Takahashi and coauthors study car salespeople and examine information in subjective ratings beyond contemporaneous sales. The setting illustrates why relationship building or assistance to others may be missing from a narrow sales count Takahashi et al., 2021. Predicting future sales is a useful validation exercise, but it does not by itself establish an unbiased ability measure: ratings may affect opportunities, effort, customer assignment, or retention, which then affect later sales.
Evaluator heterogeneity. Frederiksen, Kahn, and Lange combine personnel data and a model to distinguish supervisor leniency from genuine managerial ability and firms’ information about it. Their evidence does not support treating all high-rating supervisors as merely lenient Frederiksen et al., 2020. This is an ideal paper for teaching why “remove the supervisor fixed effect” is not an innocent measurement correction. One could remove useful variation in coaching or allocation along with rating generosity.
A workable validation design might use blinded independent assessments, crossed raters evaluating the same tasks, or externally recorded quality outcomes. Rater rotation is helpful only if its assignment process and other channels are defensible. A supervisor who changes ratings may also change tasks, feedback, morale, and promotion support. Rotations are not automatically valid instruments for a score.
Kusterer and Sliwka’s online experiment varies features of evaluation incentives and information and studies the informativeness of subjective ratings alongside evaluator social preferences Kusterer & Sliwka, 2025. Keep the experimental variation separate from measured preference heterogeneity. For an applied firm project, this suggests observing both the information a rater receives and the consequences of the rating for another person, rather than modeling rating error as homogeneous noise.
Baker, Gibbons, and Murphy offer the theoretical bridge: subjective information can complement incomplete objective measures within an incentive relationship. We use this motivation now; the full contractual enforcement problem belongs in Week 4 Baker et al., 1994.
5. Evaluation changes how the signal is produced
A worker may increase productive effort, devote effort to visible tasks, seek favorable evaluators, or influence the interpretation of ambiguous work. These are behavioral responses to the evaluation process, not merely errors imposed on a fixed outcome.
Required anchor: de Janvry and coauthors. The field experiment with local civil servants in China changes uncertainty about the evaluator’s identity. It studies evaluator-specific influence activities and work behavior under subjective evaluation Janvry et al., 2023. Its central teaching contribution is an intervention on the evaluation process itself, rather than the addition of another noisy productivity proxy. Students should separate the randomized treatment from particular proposed behavioral channels, and evaluate what the measured performance outcomes capture.
A useful protocol for reading this and related studies asks: What information or rule changed? Was pay also changed? Did task priorities change? Were administrative records measured consistently in both arms? Which behavior was observed independently of the evaluator? Which actor’s preferences determine the score? The same protocol applies in firms, schools, and professional systems without requiring the same institutional interpretation everywhere.
Career incentives already make performance endogenous even when the current wage is fixed. Holmström’s dynamic career-concerns framework explains why workers may invest effort in shaping beliefs about ability Holmström, 1999. The distinction for this week is between a more precise signal and a differently produced signal. Week 4 will ask whether the resulting effort allocation is desirable and how explicit contracts should respond.
6. Monitoring is both an observation technology and an intervention
Monitoring can change information, detection, salience, perceived trust, coordination, or discretion. An empirical study should identify the component actually varied instead of attaching all these channels to a single treatment dummy.
Detection is not incidence. If false positives are absent, a simple measurement model gives
In a hypothetical example, latent misconduct falls from 0.10 to 0.06 while detection rises from 0.25 to 0.75. Recorded incidents rise from 0.025 to 0.045. A worse administrative number can therefore coexist with improved behavior. With false positives, the additional error term must also be modeled. The practical remedy is a stable independent audit or a design that separately identifies detection, not a more elaborate regression on the same detection-dependent outcome.
Pierce, Snow, and McAfee study monitoring-technology adoption in restaurants, examining recorded theft and sales. It is a useful multiple-outcome, staggered-adoption application, not a randomized technology deployment Pierce et al., 2015. Students should ask how adoption timing, store trends, spillovers, and observation rules affect the interpretation, and how a modern group-time comparison would define the target rather than rerunning a generic before–after regression Callaway & Sant'Anna, 2021.
Bernstein’s transparency-paradox study provides a different production setting in which privacy and visibility affect organizational learning and behavior Bernstein, 2012. Falk and Kosfeld’s control experiment is a laboratory principal-agent setting with a minimum-performance restriction, not a workplace-surveillance rollout Falk & Kosfeld, 2006. Read them as distinct mechanisms and evidence types. Neither licenses a universal claim that monitoring helps or harms workers.
Recent monitoring application: Phipps. The 2026 article studies exogenous variation in unannounced teacher observations and connects monitoring to pedagogy and student outcomes Phipps, 2026. The immediate reading task is to reconstruct the observation-assignment rule before asserting which comparisons are quasi-random. Do not relabel it a randomized trial from the title. Its data note identifies proprietary microdata and a code/data-description archive. This is useful for thinking about independently measured service outcomes, but not a guaranteed public-microdata classroom replication.
7. Who receives the information? Feedback to workers versus supervisors
Firms can collect a measure without sharing it with workers; supervisors can filter, contextualize, delay, or selectively communicate it. Giving workers direct access therefore changes an information institution, even when the underlying data already exist.
Required anchor and lab motivation: Bernstein and Li. Their field experiment gives frontline mechanics direct access to their own and peers’ performance data, limiting supervisors’ exclusive intermediation while leaving supervisors informed. Four of eleven work centers were assigned treatment. The article also describes a company/union constraint on the number of employees affected; the count alone does not establish that every four-center subset was admissible. Our lab explicitly imposes uniform complete randomization as a teaching design. The paper distinguishes productive, support, and nonproductive time; reduced nonproductive time did not establish a corresponding overall productive-time increase Bernstein & Li, 2026. That distinction is the lesson, not a license to convert time categories into welfare or infer independently randomized managerial mechanisms.
The case motivates three separate questions. Did knowledge improve? Did activities change? Did the changed activities improve output, quality, or worker welfare? An intervention can answer the second without fully answering the first or third. Since own and peer information are delivered together, the study does not automatically separate self-monitoring from comparison with colleagues.
Blanes i Vidal and Nossol study relative-performance feedback without introducing a new monetary prize, but workers still faced an existing piece-rate environment Vidal & Nossol, 2011. Rilke and coauthors study input-based relative feedback in sales, compared with existing information on one’s own inputs. Responses among initially low performers show why inputs, outcomes, and conversion efficiency deserve separate columns Rilke et al., 2025. Input feedback can tell someone what behavior to change; that does not imply the same response to outcome ranks.
Factorial design thought experiment. Propose independent randomization of access to one’s own history and access to peers’ histories. Add an unchanged blinded quality measure. A further supervisor-feedback arm can test whether interpretation matters beyond raw data access. This is a proposed design, not a claim that the cited papers implemented this full factorial. Define treatment at a level where peers’ access cannot silently contaminate controls, and measure staff concerns about privacy or pressure separately from production.
8. Building a usable personnel-data panel
The minimum useful unit is often worker × task/job × evaluator × period, not simply worker-year. Preserve stable identifiers; distinguish establishment from firm; map review periods to the output they cover; preserve rubric and software versions; and flag when a record was altered after a decision. Retain raw ratings as well as any standardized score so the measurement change remains auditable.
Add a visibility ledger: recorded by whom, available to whom, and available when. Internal pay records reveal compensation decisions, not automatically employer beliefs. A researcher-observed test may be known to the firm indirectly through correlated information. A missing rating may indicate exit, exemption, leave, system failure, or selective evaluation. Those are not exchangeable zeros.
The BLS National Longitudinal Surveys are an accessible starting point for wage histories and employer-learning applications; the public-use route and restricted-access tiers are documented separately U.S. Bureau of Labor Statistics, 2026. The Linked Personnel Panel links employer and worker perspectives on HR practices and job quality, with access governed by the IAB’s product-specific conditions Institute for Employment Research, Research Data Centre, n.d.. Neither should be advertised as a public source of every firm’s minute-level output and supervisor ratings. A partner firm’s records are a separate access proposition.
The archive linked to the de Janvry article provides an optional replication route, subject to inspecting actual files and permissions Janvry et al., 2023. The Phipps archive reference concerns code and a data description, not freely downloadable original school microdata Phipps, 2024. Bernstein–Li and Ockenfels and coauthors advertise supplemental materials; those listings are not proof that all original variables can be freely redistributed. Our guaranteed lab therefore uses explicitly synthetic records.
Public documentation, public code, public microdata, and permission to redistribute are different access states. Do not request access or download restricted data automatically. The mandatory lab is offline and synthetic.
Table 2:Data and access map — checked September 21, 2026
| Source / setting | Useful records | Main research use | Access status and limitation |
|---|---|---|---|
| BLS NLS / NLSY79 U.S. Bureau of Labor Statistics, 2026 | Wage and employment histories, background characteristics and relevant test measures | Employer-learning wage profiles; construct a researcher versus employer information argument | Public-use access through NLS Investigator is documented; restricted files have separate conditions. Not a universal employer-ratings database |
| IAB Linked Personnel Panel and linked products Institute for Employment Research, Research Data Centre, n.d. | Employer HR practices and employee job-quality perspectives, repeated surveys and administrative links by product | Connect evaluation/management systems to worker outcomes across establishments | Official documentation is public; research microdata require the relevant access route. Campus teaching products are distinct, not interchangeable with full research data |
| Partner employer’s production/HR system | Worker, task, rater, rubric, timestamp, output, quality, assignment, pay, exit | Joint analysis of learning, measurement, and organizational response | Negotiated permission and confidentiality; one firm’s data do not establish external validity |
| Independent audits / standardized assessment | Blinded ratings, defect/rework checks, audited task difficulty, sampling probabilities | Validate routine measures using a different error process | Design and sampling must be specified; audits are not automatically independent or representative |
| de Janvry et al. archive Janvry et al., 2023 | Linked replication archive for evaluator-identity experiment | Optional empirical reproduction after inventory/access check | Article-to-archive link and listing verified; contents not downloaded or executed here |
| Bernstein–Li article supplement Bernstein & Li, 2026 | Publisher advertises supplemental material | Optional empirical route for data-access and time-use study | Listing verified; original files, dependencies, and redistribution permission not inspected. Required path remains synthetic |
| Phipps code/data description Phipps, 2024 | Replication code and description linked in journal data note | Learn the exact unannounced-observation design and workflow | Journal states underlying microdata are proprietary; public code does not mean public original data |
| Ockenfels et al. supplement Ockenfels et al., 2025 | Publisher lists supplemental appendix/data | Optional multirater laboratory exercise | Listing observed; data not downloaded or executed in this pack |
| New anonymous worker survey | Beliefs about evaluation, privacy, stress, clarity, perceived fairness | Worker costs and information mechanisms missing from output records | Participation and reporting selection matter; ensure aggregation, minimum necessary access, and confidentiality |
Minimum panel keys: stable worker ID, job/task ID, establishment/team ID, rater ID, measurement version, work date, recording date, information-release date, and decision date. Keep the baseline worker roster even when ratings subsequently disappear. Store confidential linkages separately from analysis extracts.
9. From a compelling dataset to an identified mechanism
Independent outcomes. A second outcome family should challenge the first rather than restate it. A supervisor’s overall score and that same supervisor’s narrative sentiment share a measurement source. Better contrasts include counts versus blinded quality audits; time use versus completed work and rework; evaluator scores versus external customer outcomes; employer profit versus worker-reported pressure and predictable hours. No single pair is universally sufficient, but the failure channels should differ.
Leave-out and time separation. Consider with mean-zero transitory noise that is independent across periods and independent of , with common variance . If a worker score uses all observations including the focal record,
Leaving the focal observation out removes this mechanical covariance under independent errors. It does not remove serial correlation, common task shocks, endogenous peer assignment, or future-information leakage. A strictly historical score is appropriate for a prospective decision, while a future independent measure can be used for retrospective validation with a different interpretation. Cross-fitting must respect worker, rater, team, and time dependence rather than randomly shuffling rows.
Kline, Saggio, and Sølvsten provide methods for noisy fixed-effect variance components. Their leave-out correction is not simply the deletion of one observation from a worker average, and neither approach by itself identifies causal evaluator effects Kline et al., 2020. Students should state the estimation target and error dependence before choosing a correction.
Selection. Follow the baseline population after a monitoring change. Report retention or observation probabilities alongside performance. The contribution to firm production of someone who exits can be defined as zero for a fixed employer-accounting target; their unobserved potential quality in that job is not observed zero. An analysis of ratings among survivors targets a selected group. Lee-style bounds require the relevant monotone-selection and assignment assumptions; balanced average attrition does not establish monotonicity Lee, 2009.
Few assignment units. A study with many worker-days but eleven independently assigned centers does not contain thousands of independent treatment assignments. In our teaching design, exactly four centers are selected uniformly from eleven. Define center outcome changes and estimate an equal-center-weighted effect:
This differs from a worker-weighted target if center sizes differ. Under the sharp null of no effect on any observed unit, evaluate the statistic under all center assignments. This is not a generic test of a weak average-effect null, and it is valid for the stated complete-randomization design, not an unknown blocked or constrained assignment. Permuting individual worker-days is wrong. For an empirical replication, use the paper’s actual randomization protocol and prespecified outcome family.
10. Research opportunities that build on this week’s evidence
The following are proposed research directions, not claims that a topic is unstudied. Each begins with an information or measurement distinction and a feasible empirical target.
Changing evaluator and sensor regimes. A new automated score, review form, or software version can alter both detection and worker behavior. Seek a parallel-run period, where old and new measures coexist, plus an independently audited outcome. The opportunity is to estimate the role of measurement changes in an apparent productivity shift, not to declare the new score true. Hold full organizational AI adoption for Week 9.
Who sees performance information? The direct-access, ranking-feedback, and evaluator-identity studies suggest experiments that independently vary information precision, recipients, and interpretation. Pair knowledge questions with task-level outcomes. Investigate which workers benefit from additional information rather than assuming uniform responses Bernstein & Li, 2026Janvry et al., 2023Rilke et al., 2025.
Learning about a moving target. Combine repeated performance assessments, task assignments, and pay histories to test a fixed-type learning model against productivity evolution. A training or rotation intervention can change both skill and information, so a clean design needs an outcome or timing restriction that separates them. The ambition is an identified decomposition with sensitivity analysis, not naming an estimated residual “ability” Kahn & Lange, 2014.
Measurement and worker welfare. Retain work-quality measures while adding pressure, autonomy, privacy, predictable scheduling, or willingness to remain. A firm can improve a targeted metric while shifting costs to employees. A study need not monetize all dimensions to avoid treating the firm’s objective as social welfare. Confidential surveys and protected analysis access should be planned before collection, not improvised afterward.
Multirater evaluation under correlated information. Use common tasks, independent assessment assignments, and known visibility rules to separate calibration from shared errors. The new outcome could be decision accuracy at a fixed review cost, or whether different groups of workers receive equally informative evaluations. Descriptive gaps or rater heterogeneity alone do not identify unfair treatment Ockenfels et al., 2025Kusterer & Sliwka, 2025.
This is a reading guide to the evidence, not a claim that every study implements the same causal design. Published issue years are used where the online-first year differs.
Table 3:Paper, design, measured object, and interpretation limit
| Paper | Setting and empirical/theoretical variation | What students should learn from the measured object | What not to claim |
|---|---|---|---|
| Farber–Gibbons Farber & Gibbons, 1996 | Employer-learning model and longitudinal wage evidence | Researcher-observed ability correlates and wage evolution can discipline information models | Every learning model predicts a declining schooling coefficient |
| Altonji–Pierret Altonji & Pierret, 2001 | Wage histories, schooling, researcher ability proxies and experience interactions | Information available to researchers versus firms is part of identification | AFQT or another proxy is necessarily unknown to all firms |
| Lange Lange, 2007 | Model-based estimation of employer learning speed | Quantify a learning process under specified restrictions | Estimated speed is a directly observed managerial updating rate |
| Kahn–Lange Kahn & Lange, 2014 | Long firm panel of ratings and pay; dynamic model | Separate learning from productivity evolution using additional performance information | Ratings are true ability, or the decomposition is assumption-free |
| Frederiksen–Kahn–Lange Frederiksen et al., 2020 | Supervisor ratings, worker/supervisor outcomes and model | Rating generosity and managerial ability can both explain evaluator heterogeneity | Supervisor fixed effects are pure bias or randomized manager effects |
| Takahashi et al. Takahashi et al., 2021 | Car-sales personnel records; ratings and sales | Subjective ratings may contain information about uncounted tasks | Predictive content alone proves unbiased ratings |
| de Janvry et al. Janvry et al., 2023 | Field experiment changing uncertainty over evaluator identity | Evaluation design can change how employees generate performance signals | Every proposed influence channel is independently randomized |
| Ockenfels–Sliwka–Werner Ockenfels et al., 2025 | Model and controlled laboratory experiment | Aggregation of ratings changes precision and incentives under assumptions | Multiple raters automatically cancel shared bias; evidence is a firm RCT |
| Kusterer–Sliwka Kusterer & Sliwka, 2025 | Online experiment varying evaluation incentives/information | Rating informativeness depends on the evaluation environment | Measured social preferences are randomly assigned traits |
| Pierce–Snow–McAfee Pierce et al., 2015 | Restaurant monitoring adoption; observational panel | Joint recorded-theft and sales outcomes invite mechanism checks | Adoption is randomized, or detected incidents equal underlying incidence |
| Bernstein Bernstein, 2012 | Factory field study and privacy experiment | Visibility can change adaptation, concealment, and learning | Monitoring is universally harmful |
| Falk–Kosfeld Falk & Kosfeld, 2006 | Laboratory control/minimum-performance game | The act of control can change workers’ responses | This is a field estimate of electronic surveillance |
| Bernstein–Li Bernstein & Li, 2026 | Field experiment giving own/peer data directly to workers | Separate data access, activity categories, and productive performance | Less nonproductive time automatically means more production or welfare |
| Blanes i Vidal–Nossol Vidal & Nossol, 2011 | Quasi-experimental relative-rank information | Feedback can matter without a newly attached prize | Existing piece-rate incentives were absent |
| Rilke et al. Rilke et al., 2025 | Sales field experiment adding relative input feedback | Separate effort inputs, sales outputs, and conversion | More inputs/outputs establish improved conversion efficiency |
| Phipps Phipps, 2026 | Exogenous unannounced observation variation; pedagogy and student outcomes | Independently measured service outcomes can test monitoring interpretations | An RCT label or full replication access follows from the abstract |
| Duflo–Hanna–Ryan Duflo et al., 2012 | Cameras plus attendance-linked pay | A joint measurement/reward package motivates the Week 4 boundary | The total effect isolates monitoring alone |
Methods papers play narrower roles: noisy variance components Kline et al., 2020, selection bounds Lee, 2009, and explicit comparison groups in staggered adoption Callaway & Sant'Anna, 2021. None replaces the institutional assignment argument.
Research Lab
Reproduce — a bounded design reconstruction
The primary reading is Bernstein and Li, with a clearly labeled offline synthetic design reconstruction. The article advertises supplemental material, but its original microdata have not been downloaded or executed for this pack. An optional empirical route may be added only after checking what the release actually contains and permits Bernstein & Li, 2026.
The included lab creates eleven centers with four assigned treatment, different center sizes, and repeated worker observations. All workers, outcomes, parameters, and treatment magnitudes are invented. Its exhaustive 480-minute time budget is a teaching simplification, not an asserted replication of the original firm’s accounting rules. Students estimate center-level changes in nonproductive, productive, and support time plus an independent quality measure. They then run exact center-assignment inference for the prespecified primary endpoint.
Diagnose — distinguish three explanations for a better score
Students examine an intervention that reallocates recorded time without a direct productive-time or quality effect in the synthetic data-generating process; a separate recording-rule change that raises a score without changing a blinded audit; and a Bayesian-learning exercise in which the employer’s uncertainty changes while the production model is explicitly specified. Additional diagnostics compare independent versus correlated ratings and demonstrate own-record leakage in a worker average.
The exercise requires a written answer to: Which effect is identified by randomization? Which difference is merely a measurement identity? Which result follows from the assumed signal model? Which welfare questions remain open? A non-significant quality effect does not establish equivalence, and a randomized dashboard does not independently randomize its behavioral channels.
Transfer — a measurement-validation design
Write a two-page proposal for a workplace measurement or feedback reform. Specify the baseline population, unit of randomization or quasi-exogenous variation, who sees which information, primary measure, independent outcome family, and worker-welfare outcome. State one plausible alternative explanation and the result that would make you change your interpretation. Add a data dictionary with timing and access restrictions. The lab handout gives the run order and diagnostics; the transfer memo template structures the proposal and data dictionary. The requirement is a credible design, not a completed empirical paper.
Methods Box
Table 4:Methods and identification checklist
| Problem | Useful design or estimator | Concrete implementation | What it still does not identify | Reading |
|---|---|---|---|---|
| Learning versus changing productivity | Dynamic model with repeated performance and pay information | Specify which components persist, measurement errors, available information, and identifying covariance patterns | Primitives without the stated dynamic/measurement restrictions | Kahn & Lange, 2014Farber & Gibbons, 1996Altonji & Pierret, 2001 |
| Rater generosity versus management | Crossed raters, worker/rater panel and independent outcomes | Preserve task and evaluator assignment; inspect mobility/rotation rules and connected support | Random causal rater effects from fixed effects alone | Frederiksen et al., 2020 |
| Strategically produced evaluations | Randomized evaluator uncertainty or information/incentive treatment | Use assigned treatment, stable outcomes, baseline eligibility and the correct assignment unit | Each behavioral mediation channel from a bundled intervention | Janvry et al., 2023Kusterer & Sliwka, 2025 |
| Monitoring changes both behavior and detection | Stable independent audits or parallel sensor versions | Record detection rules and audit sampling; measure production plus quality | Latent incident rates from a single detection-dependent record | Pierce et al., 2015Phipps, 2026 |
| Direct information versus managerial interpretation | Randomized data access; factorial own/peer/feedback design when feasible | Log data recipients, availability dates, contamination and original supervisor access | Independent own-versus-peer mechanisms when both were delivered together | Bernstein & Li, 2026 |
| Correlated ratings | Reliability/covariance analysis; independent assessment assignments | Measure cross-rater errors on common tasks; distinguish common bias from noise | Construct validity or unbiasedness from agreement alone | Ockenfels et al., 2025 |
| Own-record contamination and noisy effects | Leave-out/cross-fitted scores; appropriate variance-component estimator | Separate score estimation from the focal outcome and prospective information date | Endogenous assignment, serial dependence, or causal ability effects | Kline et al., 2020 |
| Staggered monitoring rollout | Group-time ATT design with explicit untreated comparisons | Define cohorts, control eligibility, anticipation, and aggregate weights; inspect pre-trends with appropriate caution | Causality when adoption tracks unobserved changing outcomes | Callaway & Sant'Anna, 2021 |
| Performance observed only for survivors | Baseline-cohort accounting; selection sensitivity or bounds when justified | Report missingness reasons/rates; distinguish zero contribution from missing quality; justify monotone selection before bounds | Always-survivor effects solely from similar aggregate retention rates | Lee, 2009 |
| Few randomized centers | Design-aligned randomization inference and transparent cluster estimands | Enumerate allowed assignments, use center-level statistics, prespecify outcomes; report worker vs center weighting | A generic average-effect test from a sharp-null Fisher test | Bernstein–Li motivates the issue; exact 11/4 exercise is the pack’s stated teaching design |
Implementation note: uncertainty from estimating a historical performance score is distinct from endogenous signal production. Cross-fitting, shrinkage, resampling, and fixed effects solve different problems. Choose the correction only after stating which problem is present.
Reading Ladder And References
Required (three papers). Kahn and Lange (2014): explain the restrictions separating employer learning from productivity evolution. De Janvry and coauthors (2023): reconstruct the evaluation intervention and the behavioral margins it can identify. Bernstein and Li (2026 issue; online 2025): distinguish data access, changed activities, and output claims Kahn & Lange, 2014Janvry et al., 2023Bernstein & Li, 2026.
Foundations and identification follow-up. Farber–Gibbons, Altonji–Pierret, and Lange provide the wage-learning lineage. Read them for their distinct information restrictions, not a common slogan. Kline–Saggio–Sølvsten, Lee, and Callaway–Sant’Anna are targeted methods readings for noisy components, selected outcomes, and staggered adoption, respectively Farber & Gibbons, 1996Altonji & Pierret, 2001Lange, 2007Kline et al., 2020Lee, 2009Callaway & Sant'Anna, 2021.
Rotating research presentations. Choose one evaluator paper (Frederiksen–Kahn–Lange, Ockenfels–Sliwka–Werner, Kusterer–Sliwka, or Takahashi et al.) and one monitoring/feedback paper (Phipps, Pierce et al., Bernstein, Blanes i Vidal–Nossol, or Rilke et al.). Each presentation must give the data source, variation, information change, independent outcome, and an interpretation limit Frederiksen et al., 2020Ockenfels et al., 2025Kusterer & Sliwka, 2025Takahashi et al., 2021Phipps, 2026Pierce et al., 2015Bernstein, 2012Vidal & Nossol, 2011Rilke et al., 2025.
Bridge readings, not a second contracts lecture. Holmström, Baker–Gibbons–Murphy, Falk–Kosfeld, and Duflo–Hanna–Ryan show why observation, beliefs, and rewards interact. The camera-and-attendance-pay intervention in Duflo and coauthors is specifically a bundle, not evidence about monitoring alone; this chapter uses only that design distinction, and any reproduction of the original structural calculations must first consult the journal erratum Holmström, 1999Baker et al., 1994Falk & Kosfeld, 2006Duflo et al., 2012.
Table 5:Reading ladder and laboratory map
| Tier / activity | Paper or resource | Student output |
|---|---|---|
| Required: dynamic learning | Kahn–Lange Kahn & Lange, 2014 | Information timeline and a table of observed moments versus latent components |
| Required: evaluation behavior | de Janvry et al. Janvry et al., 2023 | Treatment-component ledger and one alternative mechanism |
| Required: data access | Bernstein–Li Bernstein & Li, 2026 | Outcome/denominator map distinguishing productive, support, and nonproductive time |
| Classic learning pathway | Farber–Gibbons; Altonji–Pierret; Lange Farber & Gibbons, 1996Altonji & Pierret, 2001Lange, 2007 | Compare actual restrictions; do not impose one schooling-coefficient prediction on all models |
| Evaluator presentation (choose one) | Frederiksen–Kahn–Lange; Ockenfels et al.; Kusterer–Sliwka; Takahashi et al. Frederiksen et al., 2020Ockenfels et al., 2025Kusterer & Sliwka, 2025Takahashi et al., 2021 | A validation design that separates information content from evaluator preferences/ability |
| Monitoring/feedback presentation (choose one) | Phipps; Pierce et al.; Bernstein; Blanes i Vidal–Nossol; Rilke et al. Phipps, 2026Pierce et al., 2015Bernstein, 2012Vidal & Nossol, 2011Rilke et al., 2025 | Explain the variation, outcome families, and what the paper cannot attribute separately |
| Methods as needed | Kline–Saggio–Sølvsten; Lee; Callaway–Sant’Anna Kline et al., 2020Lee, 2009Callaway & Sant'Anna, 2021 | A justified correction matched to a named estimation/identification problem |
| Week 4 bridge | Holmström; Baker–Gibbons–Murphy; Falk–Kosfeld; Duflo–Hanna–Ryan Holmström, 1999Baker et al., 1994Falk & Kosfeld, 2006Duflo et al., 2012 | Distinguish measurement change, implicit incentive, and explicit contract change |
| Lab: Reproduce | Bernstein–Li-inspired synthetic center experiment | Center-level contrasts and design-aligned sharp-null tests; not published estimates |
| Lab: Diagnose | New toy measurement and signal examples | Audit recording-only change, correlated raters, updating, and own-record leakage |
| Lab: Transfer | Student’s proposed workplace study | Two-page design, measurement dictionary, independent outcome family, worker-welfare measure |
Teaching route: use a substantive lecture plus a separate research-lab discussion, or two meetings. Do not compress the uncertainty, measurement, and selection distinctions into a list of paper titles. The breadth of the bibliography is a resource for projects; only three papers are required.
Exercises And Discussion Prompts
A monitoring reform raises recorded safety incidents but reduces independent audit failures. Give a measurement explanation, a behavioral explanation, and one additional datum that would discriminate between them.
Derive the two posterior updates in the numerical example. Which object changes when signal precision improves? Why does this not identify a causal effort response?
Explain why four raters with strongly correlated errors may add little information. Propose a reviewer assignment rule that could make the marginal information content measurable.
A supervisor fixed effect predicts both high ratings and high worker output. Explain why neither pure leniency nor causal managerial ability follows automatically.
Reconstruct one classic employer-learning paper’s information assumptions. Which prediction would fail if the firm already observed the researcher’s ability proxy?
Design a feedback experiment that separates own-information access from peer comparison. Specify contamination channels and the assignment unit.
In the synthetic lab, compare a change in recorded time with a change in quality. Explain why the point estimates and sharp-null tests answer narrower questions than “does the reform improve welfare?”
Deliver the two-page transfer proposal and a measurement dictionary with two independent outcome families, a welfare measure, and a falsifiable alternative explanation.
Reproducibility And Code Lab Note
Download the teaching repository (ZIP), or clone the repository. Keep its folder structure and open books/special-topic8-organizational/labs/03-performance-measurement-monitoring-and-employer-learning/; the lab README supplies the run instructions. Weeks 1–3 use the shared plotting module supplied with the repository.
The Week 3 lab handout guides Reproduce, Diagnose, and Transfer. From labs/03-performance-measurement-monitoring-and-employer-learning/, run:
ENV_NAME=research bash smoke.shThe mandatory Mode A is synthetic design reconstruction, with empirical_replication: false. The standard-library core invents 76 workers and 1,216 worker-period records across eleven centers; its 480-minute accounting rule and all effect sizes are teaching assumptions. The smoke executes assignment and schema checks, enumerates all 330 possible center assignments, verifies time accounting, posterior updating, correlated-rater variance, detection arithmetic, and own-record leakage, and compares deterministic reruns. Plotting uses the existing Matplotlib environment. It needs no network, restricted input, or credential.
The optional Mode B original-release route is omitted. A publisher supplement listing does not establish original-data availability, redistribution permission, or successful empirical replication. The instructor-only file contains separated synthetic truth, not confidential personnel data.
Rebuild the chapter figure from this book directory after the lab has generated its CSVs:
conda run -n research python assets/scripts/build-week3-learning.pyThe script copies the lab’s generated uncertainty data to assets/data/03-learning-uncertainty.csv and produces the PNG/PDF in assets/figures/. Parameters, paths, and synthetic provenance are explicit; no empirical chart is copied.
Slide Companion Note
The Week 3 slide deck (PDF) follows the production/recording distinction, signal models, required paper designs, monitoring and feedback comparisons, and research lab. The Beamer source uses the finished Week 1–2 style. The full lecture supports two meetings or a lecture plus lab discussion; the chapter’s longer evidence and reading maps serve as handouts.
Bridge Forward
A firm must first decide what it can learn and measure. It must then decide what to reward. Week 4 adds the compensation, risk-sharing, multitasking, and relational-contract problem. Carry this week’s discipline forward: attaching stronger rewards to a number is not the same thing as increasing the value of the underlying work.
- Hoffman, M., & Stanton, C. T. (2025). People, Practices, and Productivity: A Review of New Advances in Personnel Economics. In Handbook of Labor Economics (Vol. 6, pp. 729–818). Elsevier. 10.1016/bs.heslab.2025.07.005
- Benson, A., & Shaw, K. (2025). What Do Managers Do? An Economist’s Perspective. Annual Review of Economics, 17, 635–664. 10.1146/annurev-economics-082222-073303
- Kahn, L. B., & Lange, F. (2014). Employer Learning, Productivity, and the Earnings Distribution: Evidence from Performance Measures. The Review of Economic Studies, 81(4), 1575–1613. 10.1093/restud/rdu021
- Frederiksen, A., Kahn, L. B., & Lange, F. (2020). Supervisors and Performance Management Systems. Journal of Political Economy, 128(6), 2123–2187. 10.1086/705715
- Bernstein, E., & Li, S. X. (2026). The Performance Effects of Giving Front-Line Employees Direct Access to Performance Data and Thereby Limiting the Supervisor’s Feedback-Intermediation Role: Evidence from a Field Experiment. Management Science, 72(2), 805–835. 10.1287/mnsc.2022.02395
- Takahashi, S., Owan, H., Tsuru, T., & Uehara, K. (2021). Multitasking Incentives and the Informative Value of Subjective Performance Evaluations. ILR Review, 74(2), 511–543. 10.1177/0019793919891980
- Ockenfels, A., Sliwka, D., & Werner, P. (2025). Multirater Performance Evaluations and Incentives. Journal of Labor Economics, 43(4), 985–1004. 10.1086/730321
- Farber, H. S., & Gibbons, R. (1996). Learning and Wage Dynamics. The Quarterly Journal of Economics, 111(4), 1007–1047. 10.2307/2946706
- Altonji, J. G., & Pierret, C. R. (2001). Employer Learning and Statistical Discrimination. The Quarterly Journal of Economics, 116(1), 313–350. 10.1162/003355301556329
- Lange, F. (2007). The Speed of Employer Learning. Journal of Labor Economics, 25(1), 1–35. 10.1086/508730
- Kusterer, D. J., & Sliwka, D. (2025). Social Preferences and the Informativeness of Subjective Performance Evaluations. Management Science, 71(5), 4028–4048. 10.1287/mnsc.2022.02267
- Baker, G., Gibbons, R., & Murphy, K. J. (1994). Subjective Performance Measures in Optimal Incentive Contracts. The Quarterly Journal of Economics, 109(4), 1125–1156. 10.2307/2118358
- de Janvry, A., He, G., Sadoulet, E., Wang, S., & Zhang, Q. (2023). Subjective Performance Evaluation, Influence Activities, and Bureaucratic Work Behavior: Evidence from China. American Economic Review, 113(3), 766–799. 10.1257/aer.20211207
- Holmström, B. (1999). Managerial Incentive Problems: A Dynamic Perspective. The Review of Economic Studies, 66(1), 169–182. 10.1111/1467-937X.00083
- Pierce, L., Snow, D. C., & McAfee, A. (2015). Cleaning House: The Impact of Information Technology Monitoring on Employee Theft and Productivity. Management Science, 61(10), 2299–2319. 10.1287/mnsc.2014.2103